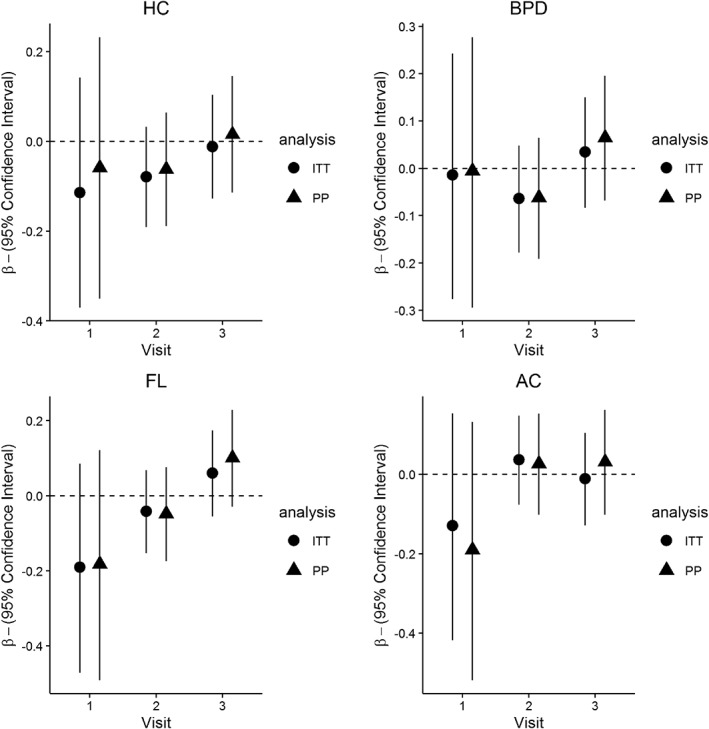
Figure 3.

Standardised regression coefficients β (and 95% confidence interval) for the effect of the intervention on HC, BPD, FL, and AC at visits 1, 2, and 3. Results are taken from the unadjusted analysis (differences are computed as treatment − control. A positive β indicates larger size in the intervention group). Circles refer to the mean difference in fetal size between control and treatment groups in the intention‐to‐treat analysis. Triangles represents the same values estimated in the per‐protocol analysis. AC = abdominal circumference; BPD = biparietal diameter; FL = femur length; HC = head circumference; ITT = intention‐to‐treat; PP = per‐protocol
