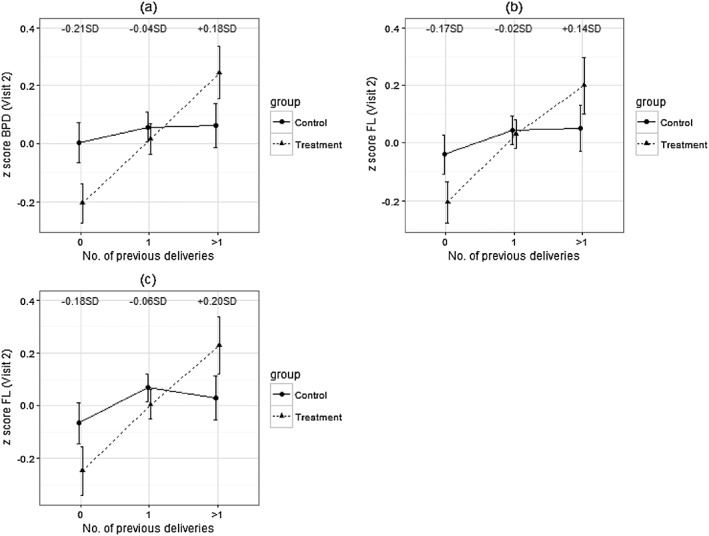
Figure 4.

Effect of the intervention on BPD and FL at visit 2 according to maternal parity. Values are means; error bars indicate 95% confidence intervals. Panels (a) and (b) refer to the results obtained in the intention‐to‐treat analysis. Panel (c) summarises the results from the per‐protocol analysis (women who started supplementation ≥3 months before their last menstrual period date). The numbers in each figure summarise the mean difference between treatment and control of the considered measure according to parity. BPD = biparietal diameter; FL = femur length
