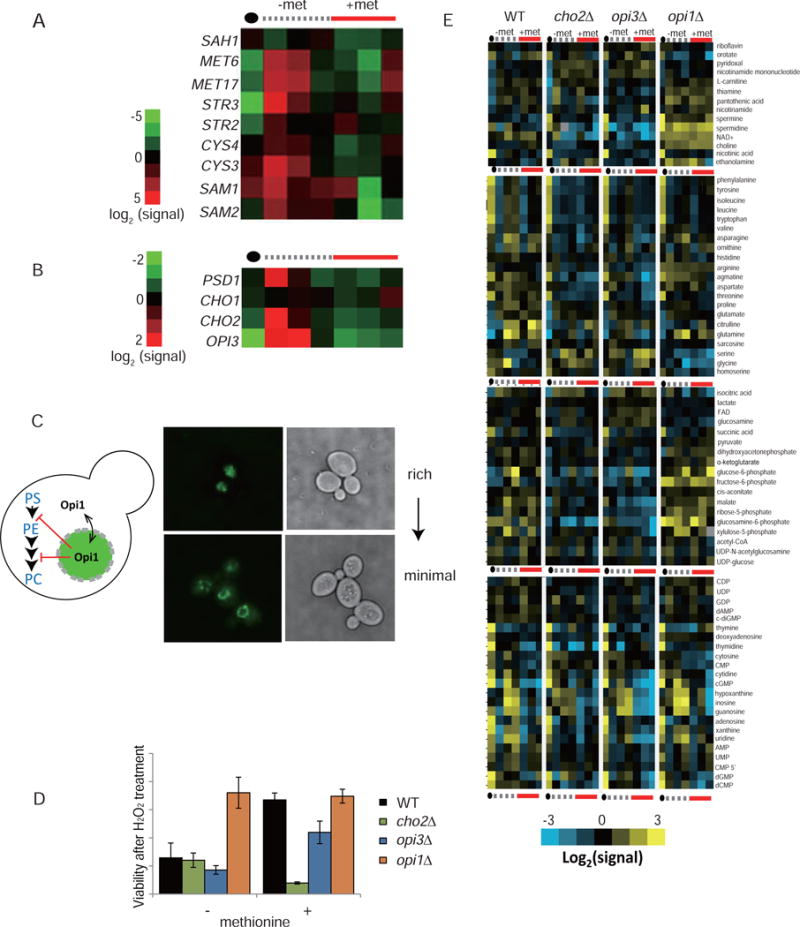
Figure 3. Coordination of phospholipid methylation with sulfur metabolism is required for metabolic homeostasis and survivability against oxidative stress.

(A) Heat maps depicting mRNA levels of major sulfur metabolic genes and (B) phospholipid biosynthetic genes in response to the switch from YPL to SL or SL containing methionine. Numerical data are presented in Table S2.
(C) Localization of the transcriptional repressor Opi1-GFP in YPL or SL medium.
(D) Cell viability of the indicated strains following treatment with 5 mM H2O2 in SL medium with or without methionine. Data are represented as mean ± SD (n=3). Note that supplementation of methionine promotes survival of WT but not cho2Δ cells.
(E) Heat maps depicting abundances of major cellular metabolites in indicated cells switched from YPL to SL with or without methionine. The data are representative of two independent time courses and subject to hierarchical clustering. Numerical data are presented in table S1. See also Figure S4.
