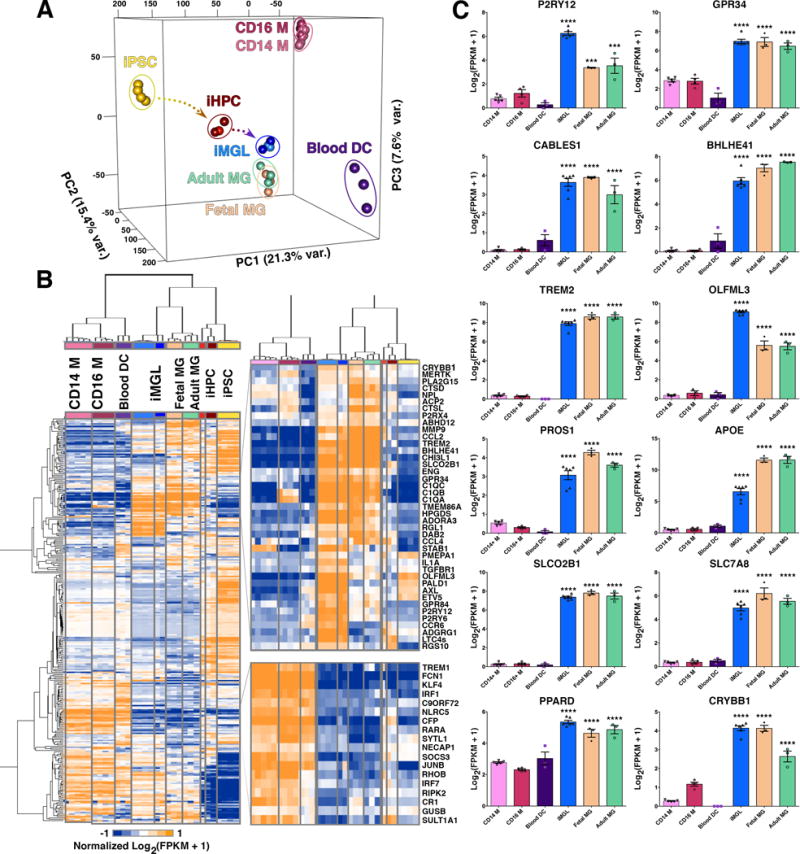
Figure 2. iMGL transcriptome profile is highly similar to human adult and fetal microglia.

(A) 3D Principal Component Analysis (PCA) of iMGLs (blue), human adult microglia (Adult MG; green), human fetal microglia (Fetal MG; beige), CD14+/CD16− monocytes (CD14 M; pink), CD14+/16+ monocytes (CD16 M; maroon), blood dendritic cells (Blood DC; purple), iHPCs (red), and iPSCs (yellow) (FPKM ≥ 1, n=23,580 genes). PCA analysis reveals that iMGL cluster with Adult and Fetal MG and not with other myeloid cells. PC1 (21.3% var) reflects the time-series of iPSC differentiation to iHPC (yellow arrow) and then to iMGLs (blue arrow). PC2 (15.4% var) reflects the trajectory to Blood DCs. PC3 (7.6% var) reflects the trajectory to monocytes (B) Heatmap and biclustering (Euclidean-distance) on 300 microglia, myeloid, and other immune related genes (Butovsky et al., 2014; Hickman et al., 2013; Zhang et al., 2014). A pseudo-count was used for FPKM values (FPKM +1), log2-transformed and each gene was normalized in their respective row (n=300). Representative profiles are shown for genes up and down regulated in both human microglia (fetal/adult) and iMGLs. (C) Bar graphs of microglial-specific or –enriched genes measured in iMGL, Fetal and Adult MG, Blood DC, CD14 M, and CD16 M as [Log2 (FPKM +1)] presented as mean ± SEM. Data was analyzed using one-way ANOVA followed by Tukey’s corrected multiple comparison post hoc test. Statistical annotation represents greatest p-value for iMGL, Fetal MG, and Adult MG to other myeloid cells. CD14 M (n=5, CD16 M (n=4), Blood DC (n=3), iMGL (n=6), Fetal MG (n=3), and Adult MG (n=3). *p<0.05, **p<0.01, ***p<0.001, ****p<0.0001. Complete statistical comparisons are provided in Table S1. See also Figures S2 and S3.
