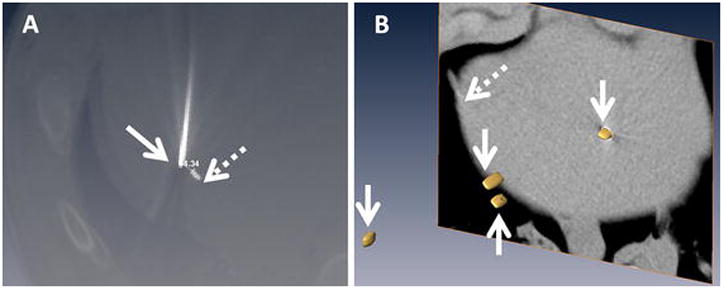
Figure 4. Representative Seed Location and Accuracy Measurement.

A: Screenshot showing needle placed (solid arrow) to a target (dashed arrow) in the liver. The image set used for treatment planning was registered with post-treatment confirmation scan to allow measurements.
B: Volumetric distribution of the targets extracted as isosurfaces (arrows) within the liver. CT slice showing on section of the liver is shown in the background (liver boundary marked with dashed arrow).
