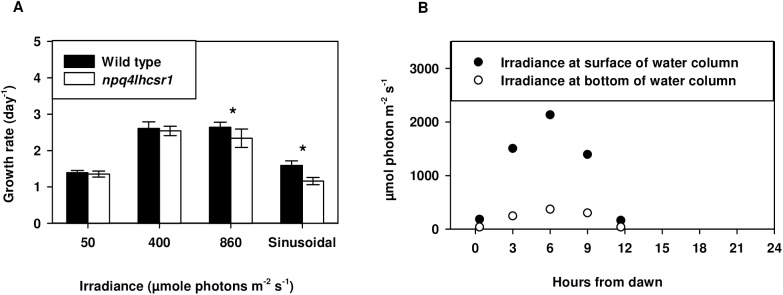
Fig 2. npq4lhcsr1 growth rate under continuous and sinusoidal conditions.
(A) Chlamydomonas exponential growth rates determined by cell counts collected over 2–3 days of growth. Symbols (*) represent significant differences from wild type within light acclimated states based on an un-paired t-test (p < 0.05). Data represents means + s.d. (n = 7–9) (B) Light levels measured across the 12:12 light dark cycle used for the sinusoidal light regime.

