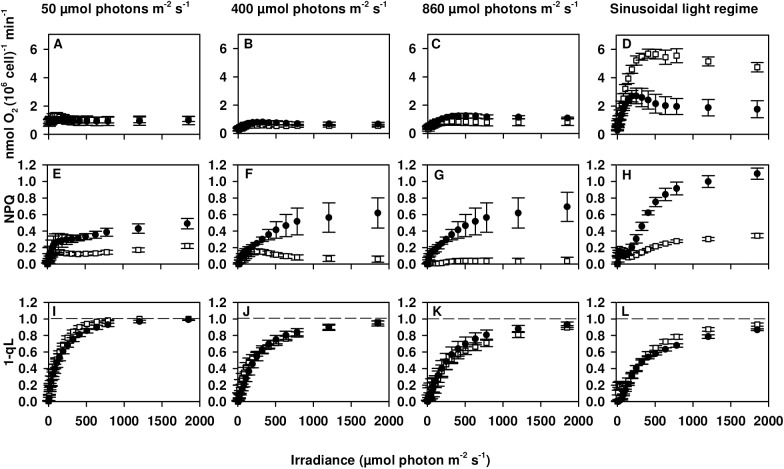
Fig 3. Photosynthesis vs Irradiance (P vs I) curves for wild type and npq4lhcsr1 acclimated to different light regimes.
Wild type (black circles) and the npq4lhcsr1 mutant (white squares) acclimated to either 50, 400, 860 μmol photons m-2- s-1 or a sinusoidal light regime (data collected 6 hours after dawn) were exposed to consecutive, increasing intensities of red light. Oxygen concentrations and PAM fluorescence were measured simultaneously. Data represent means ± s.d. (n = 3–6).

