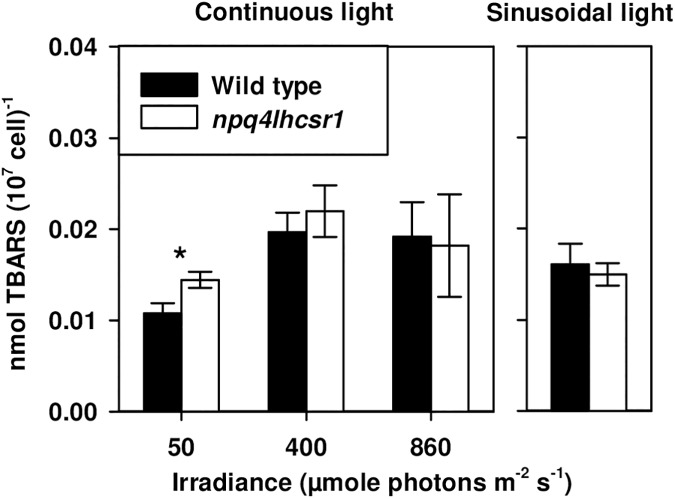
Fig 6. Thiobarbituric acid reactive substance (TBARS) concentrations per 107 cell for wild type and npq4lhcsr1 acclimated to different light regimes.
Data represents the mean ± SD (n = 3–6). Symbols (*) represent significant differences from wild type within light acclimated states based on an un-paired t-test (p < 0.05).

