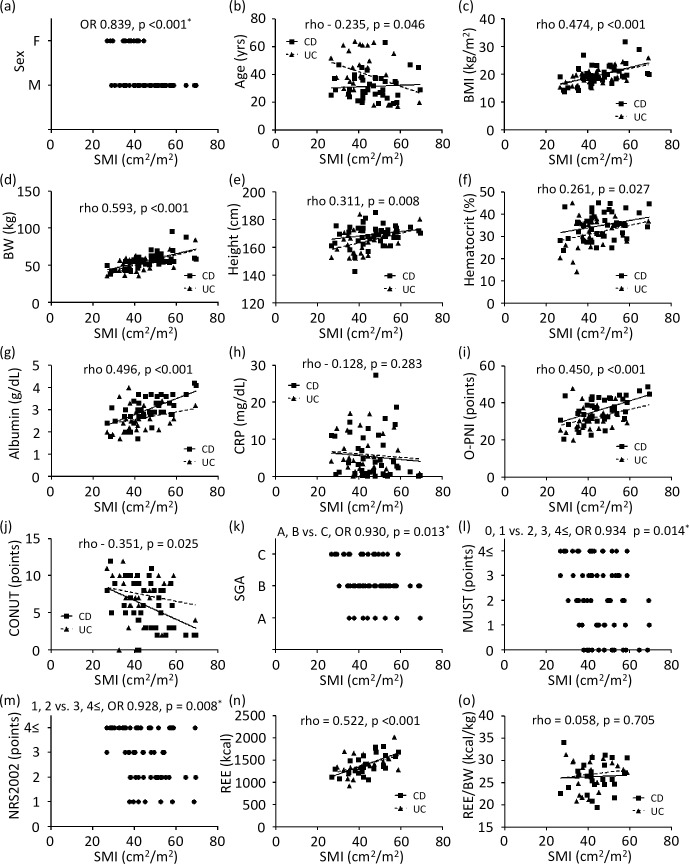
Fig 1.
Dispersion graphs depicting correlations between SMI and sex (a), age (b), BMI (c), BW (d), height (e), hematocrit (f), albumin (g), CRP (h), O-PNI (i), CONUT (j), SGA (k), MUST (l), NRS-2002 (m), REE (n), and REE/BW (o). P values on each graph were calculated for all IBD patients. Rho indicates Spearman’s rank correlation coefficient. *Logistic regression analysis. OR: odds ratio, SMI: skeletal muscle index, BMI: body mass index, BW: body weight, CRP: C-reactive protein, O-PNI: Onodera’s prognostic nutritional index, CONUT: controlling nutritional status, SGA: subjective global assessment, MUST: malnutritional universal screening tool, NRS-2002: nutritional risk screening-2002, REE: resting energy expenditure.

