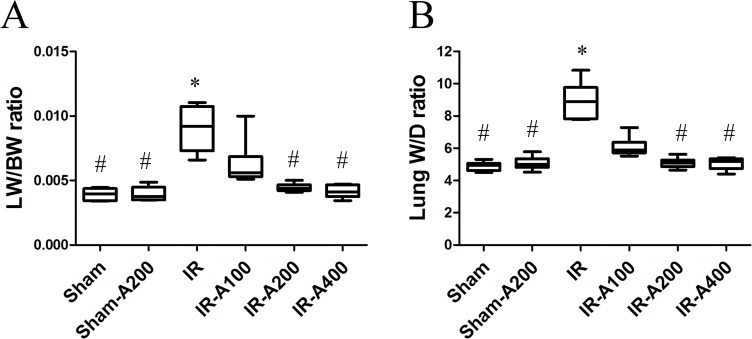
Fig 3. AZA decreased IR-induced pulmonary edema.
Lung weight/body weight (LW/BW) (A) and wet/dry weight (W/D) (B) ratios were significantly higher in the IR than sham groups (p<0.05 as compared between the IR and sham). The IR-A200 and IR-A400 groups had significantly lower LW/BW and W/D than the IR group (p<0.05 as compared between the IR and IR with AZA groups). There was a significant difference from the * Sham (p<0.05) and #IR (p<0.05) groups. Sham group; Sham-A200, Sham + AZA 200mg/kg BW group; IR, ischemia-reperfusion group; IR-A100, IR + AZA 100mg/kg BW group; IR-A200, IR + AZA 200mg/kg BW group; IR-A400, IR + AZA 400mg/kg BW group.

