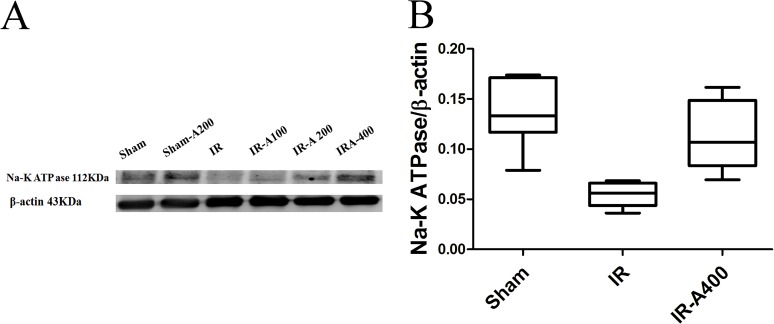
Fig 14. Membranous Na-K-ATPase α1 in lung tissues.
Resperentative (A) and quantitative analyses (B) showed that Na-K-ATPase α1 expression was higher in the sham group than that in the IR group (p<0.05 as compared between the sham and IR group). IR-A400 group restored expression of Na-K-ATPase α1 (p<0.05 as compared between the IR and IR-A400 group). There was a significant difference from the * Sham (p<0.05) and #IR (p<0.05) groups. Sham group; IR, ischemia-reperfusion group; IR-A400, IR + AZA 400mg/kg group.

