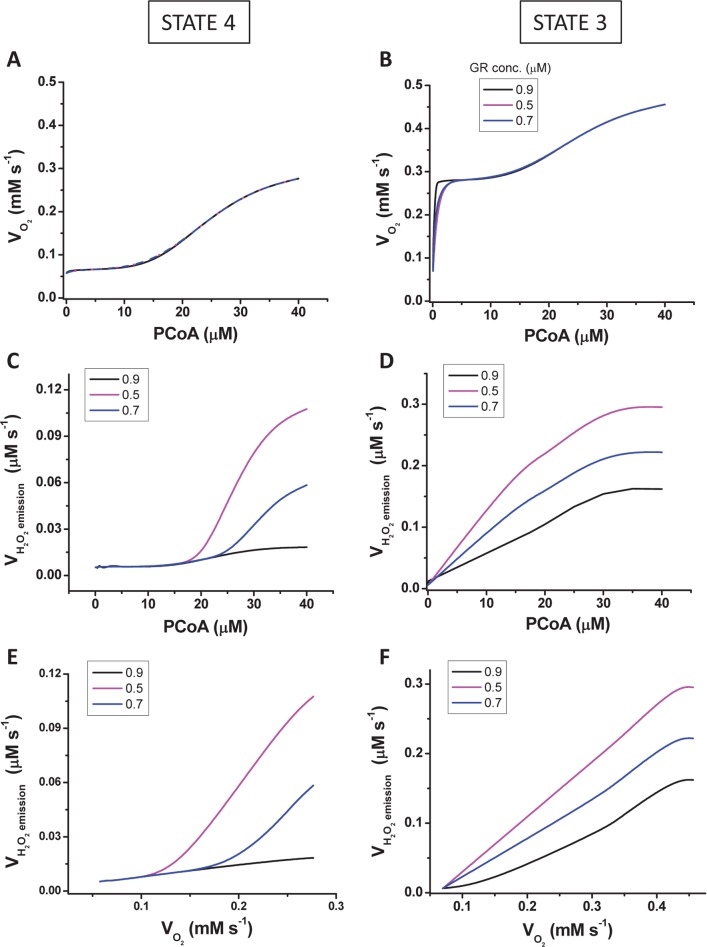
Fig 3. Model simulations of mitochondrial respiration and ROS emission fluxes from Sham and diabetic mitochondria vs. PCoA concentration.
Steady state values of the rates of respiration (VO2) (A, B), H2O2 emission (VH2O2) (C, D) and their relationship, i.e. VH2O2 vs. VO2 (E, F) were obtained at the indicated levels of PCoA (in μM) under states 4 (A, C, E) and 3 (B, D, F) respiration. The plots display total VO2 (i.e., derived from NADH, succinate and FADH2 driven electron transport). The three curves represent simulations obtained at three different Vmax values of glutathione reductase (both intra- and extra-mitochondrial) as indicated in the legend of the plots. The model parameterization and initial conditions employed in the simulations are described in S1 Text together with the Matlab code for the full computational model.

