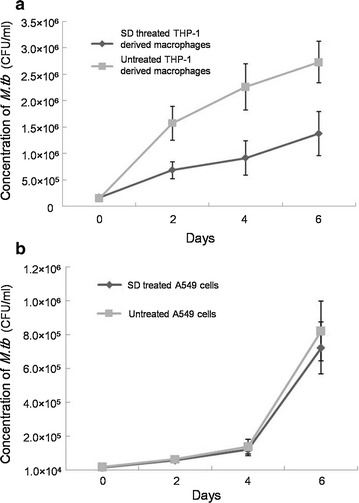
Fig. 2.

Growth of M.tb in THP-1-derived macrophages (a) and A549 cells (b). Results are expressed as CFU/ml. The data represent the average and the standard deviation obtained from 6 parallel independent infections. The experiment was repeated 4 times
