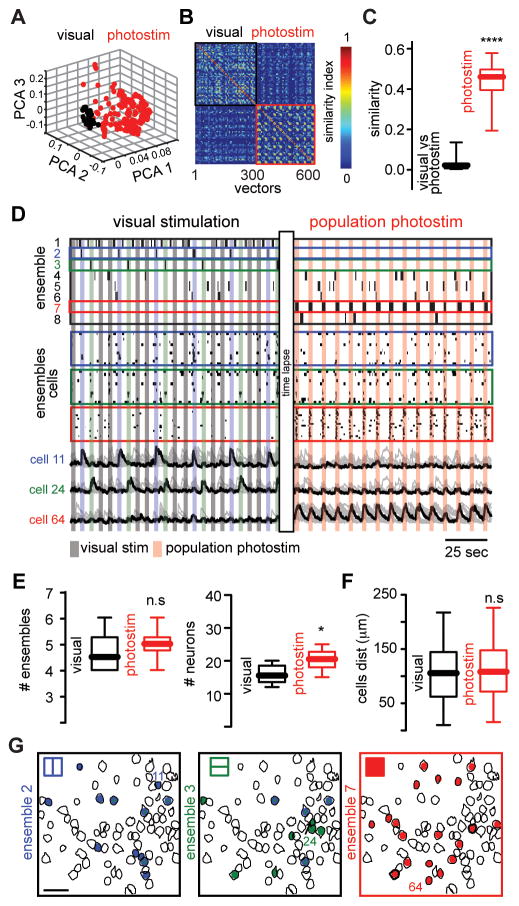
Fig. 2. Population photostimulation generates artificial cortical ensembles.
(A) Principal component analysis (PCA) of population vectors evoked by visual stimuli (black) and optogenetic photostimulation (red). (B) Similarity map representing the angle between population vectors during visual stimuli (black) or population photostimuli (red). (C) Population similarity between visually and photostimulated evoked activity (n = 6 mice; ****P < 0.0001). (D) Time course activation of evoked cortical ensembles (top) aligned with raster plots representing the activity of visually evoked ensembles and photoensemble (middle) and calcium transients (bottom) of the most representative neurons of each ensemble. Colored boxes indicate ensemble label. (E) The total number of ensembles remained stable in both conditions (top; n = 6 mice; n.s P=0.4315). The number of cells defining photoensembles is significantly higher than neurons defining each visually evoked ensemble (bottom, n = 6 mice; *P = 0.0446). (F) Spatial maps of cortical ensembles in both experimental conditions. Scale bar 50 μm. (G) Distance between all neurons belonging to each ensemble (n = 6 mice; n.s. P = 0.3720). Data presented as whisker box plots displaying median and interquartile ranges analyzed using Mann-Whitney test.

