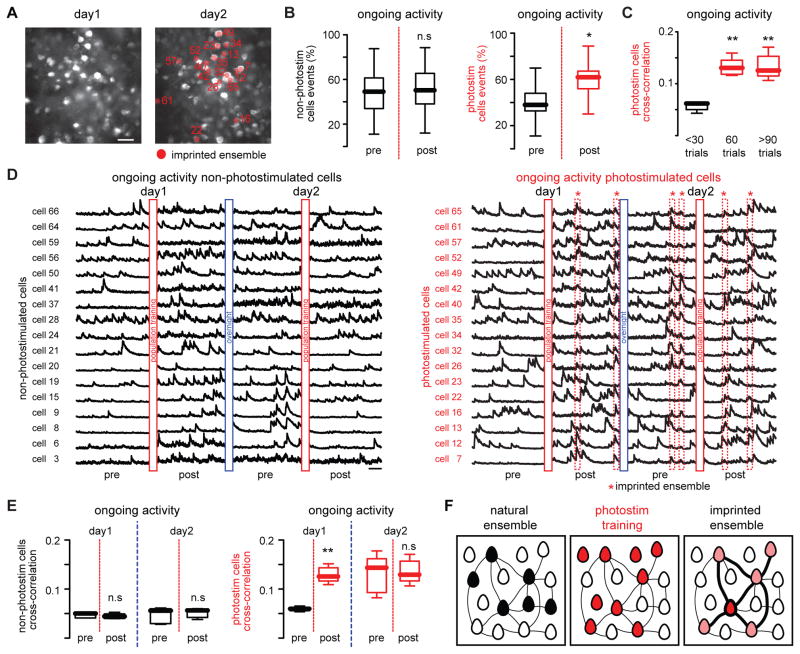
Fig. 4. Imprinted ensembles persist after consecutive days.
(A) Images showing the same optical field at two different days. Scale bar 50 μm. (B) Percentage of events during ongoing activity of non-photostimulated cells remains stable (left; n = 5 mice; n.s P=0.5664; Wilcoxon matched-pairs signed rank test) whereas photostimulated cells increased their activity (right; n = 5 mice; *P = 0.0147; Wilcoxon matched-pairs signed rank test) after population training. Red line denotes population training. (C) The enhancement of cross-correlation between photostimulated cells depends on the number of training trials (n = 5 mice; **P = 0.0092; Kruskal-Wallis test). (D) Calcium transients of non-photostimulated neurons (left) and photostimulated neurons (right) during ongoing cortical activity at two different days before and after population training. Imprinted ensembles recur spontaneously at consecutive days (dotted red boxes). (E) Cross-correlation between non-photostimulated neurons (left; n = 5 mice; day 1: n.s. P = 0.5476; day 2: n.s. P = 0.8413; Mann-Whitney test) and photostimulated neurons (right; n = 5 mice; day 1: **P = 0.079; day 2: n.s. P = 1; Mann-Whitney test) during ongoing activity at consecutive days. (F) Population photostimulation enhances the functional connectivity between responsive neurons. Lines widths represent the strength of the functional connectivity between neurons. Data presented as whisker box plots displaying median and interquartile ranges.

