
Figure 4.
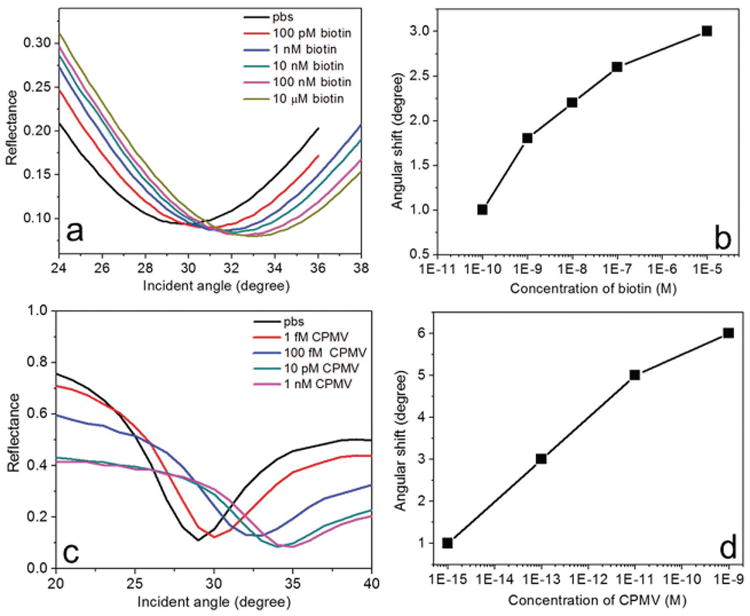
Angular detection of low and high molecular weight biomolecules at ultralow concentrations. a) Reflectance spectra of the sensor device at 1250 nm for different concentrations (100 × 10−12 m to 10 × 10−6 m) of biotin in PBS. b) The variation of angular shift with different concentrations of biotin. c) Reflectance spectra of the sensor device at 1250 nm for different concentrations (1 × 10⁻¹⁵ m to 1 × 10⁻⁹ m) of CPMV in PBS. b) The variation of angular shift with different concentrations of CPMV. Angular shift showed a distinct positive shift and nonlinear variation with increasing concentration. The angular resolution of the instrument was set to 0.1°. The size of the data points in (b) and (d) represent the error bar.