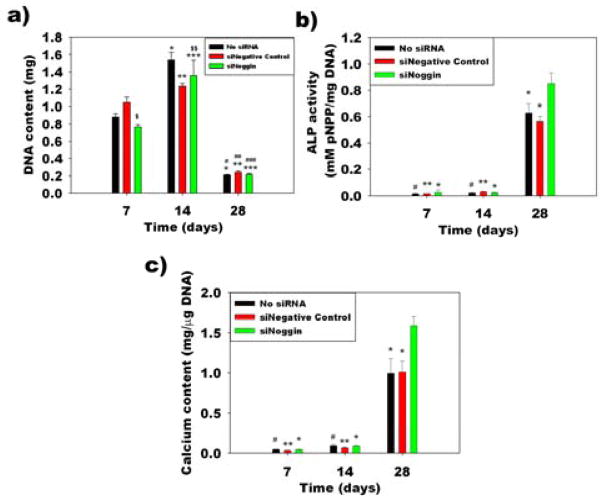
Figure 9.
(a) Quantification of DNA content in hMSC-hydrogel constructs. *p < 0.05 compared to the no siRNA group at day 7, **p < 0.05 compared to the siNegative control group at day 7, ***p < 0.05 compared to the siNoggin group at day 7, #p < 0.05 compared to the no siRNA group at day 14, ##p < 0.05 compared to the siNegative control group at day 14, ###p < 0.05 compared to the siNoggin day 14, $p < 0.05 compared to the negative control group at day 7 and $$p < 0.05 compared to the no siRNA group at day 14. (b) ALP activity and (c) calcium content in the hMSC-hydrogel constructs. *p < 0.05 compared to the siNoggin group at day 28, **p < 0.05 compared to the siNegative control group at day 28 and #p < 0.05 compared to the no siRNA group at day 28.

