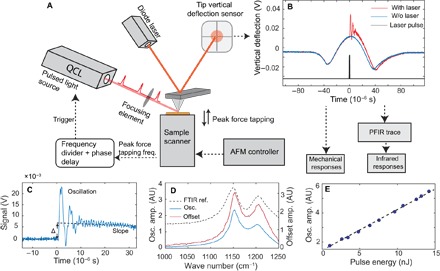
Fig. 1. Operational scheme of PFIR microscopy.

(A) Operation diagram for the PFIR apparatus. Detailed operation mechanisms are described in Materials and Methods. (B) Gate-averaged traces of vertical deflections of the cantilever with the laser interaction (red curve) and without the laser interaction (blue curve). The timing of the infrared laser pulse (black curve) is chosen to be within the contact regime of the peak force tapping cycle. Subtraction of the two vertical deflection traces is used to obtain the PFIR trace. (C) The PFIR trace of PTFE at the infrared frequency of 1160 cm−1 is shown. The laser interaction leads to three types of behaviors: (i) the contact resonance oscillation of the cantilever, (ii) the baseline offset Δ, and (iii) the slope of the baseline. (D) PFIR spectra of PTFE from the oscillation amplitude (osc. amp.) (blue curve) and the baseline offset (red curve) across its vibrational resonances. The FTIR spectrum for a bulk sample is included as a reference (black dashed curve). AU, arbitrary units. (E) The power dependence of the PFIR oscillation amplitudes for the PTFE sample versus the pulse energy of the infrared laser. A linear dependence is observed.
