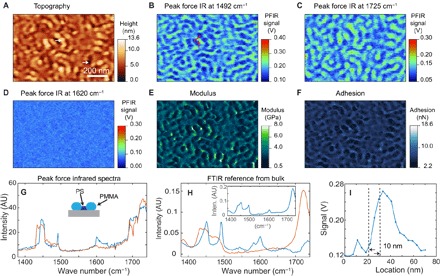
Fig. 3. PFIR imaging of nanophase separation of a PS-b-PMMA block copolymer.

(A) Topography of the PS-b-PMMA block copolymer. (B) PFIR image at the infrared frequency of 1492 cm−1, resonant with one of the vibrational modes of polystyrene. Therefore, the domains of polystyrene provide high PFIR signals. (C) PFIR at the infrared frequency of 1725 cm−1. The infrared frequency is resonantly exciting the vibrational mode of PMMA; therefore, the domains of PMMA provide high PFIR signals. (D) PFIR image at the infrared frequency of 1620 cm−1. The frequency is off-resonant with both PMMA and polystyrene, so a low PFIR response is observed. (E and F) Simultaneously registered modulus map (E) and adhesion map (F) of the same region of block copolymer. (G) PFIR spectra taken at the two locations marked by the white arrows in (A). The spectrum (red curve) is taken from the ridge of the topography and corresponds to the PMMA domains. The spectrum (blue curve) is taken from the valley of the topography and corresponds to the polystyrene (PS) domain. (H) The reference FTIR spectra from the bulk sample of PMMA (red curve), polystyrene (blue curve), and the PS-b-PMMA block copolymer (inset). The PFIR spectra show good agreement with the reference FTIR spectra from the bulk. inten., intensity. (I) Estimation of the spatial resolution from a section profile in (B) shows a spatial resolution of 10 nm, from the width between 90 and 10% of the edge height of the PFIR signal.
