
Fig. 5. Relative observation frequency of groupmates at different relative x or y coordinates, and mean speed as a function of the relative x or y coordinates or partner fish.
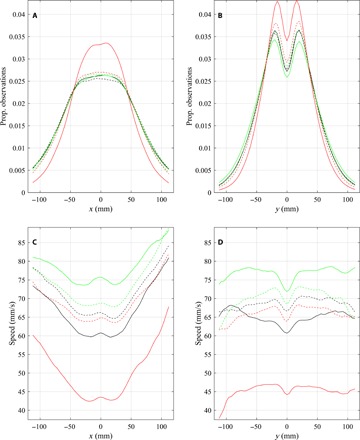
(A to D) Relative frequency that partner fish were observed at given (A) x coordinates or (B) y coordinates relative to focal fish located at the origin and the mean speed (the mean of s(t)) of focal fish as a function of relative (C) x coordinates or (D) y coordinates of all other partner fish. Curves corresponding to control trials are plotted in black, curves corresponding to food treatments are plotted in green, and curves corresponding to alarm cue treatments are plotted in red. Error bars are omitted in (C) and (D) as the error bars appear to lie directly on top of, and obscure, the mean curves at the scale that these plots are presented here. Data before application of a cue are plotted as a dashed line; post-cue data are plotted as solid lines. Note that in (B) and (D), the motion of focal fish is out of and perpendicular to the page, toward the reader. The calculations used to generate these plots are detailed in sections S1.2 and S1.5.