
Fig. 6. Relative observation frequency of groupmates as a function of relative groupmate locations.
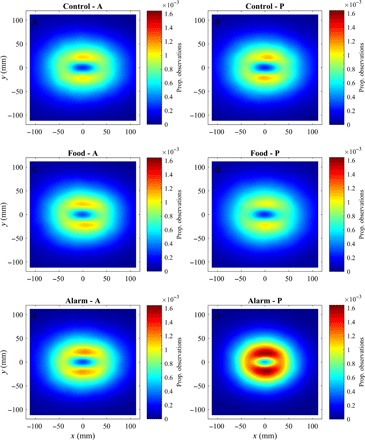
(A to F) Relative frequency of observations of all other groupmates before (A, C, and E) and after (B, D, and F) application of cues for focal fish located at the origin, for fish subject to control (A and B), food (C and D), or alarm (E and F) treatments. The direction of motion of focal fish in each plot is parallel to the positive x axis. The calculations used to generate these plots are detailed in sections S1.2 and S1.5.