
Figure 2.
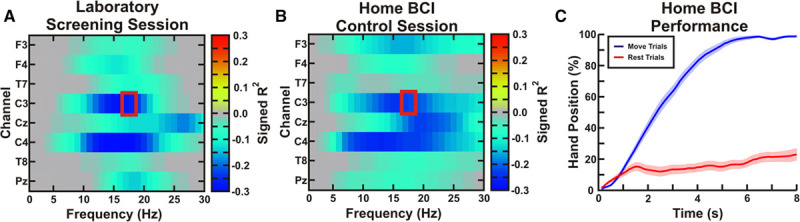
Exemplar electroencephalographic (EEG) activity and brain–computer interface (BCI) control. A, During an exemplar laboratory-based screening session, the patient (patient 10, left affected) demonstrated significant decreases in μ- and β-band spectral power bilaterally. The color scale shows signed r2 values indicating increases (positive values) and decreases (negative values) in spectral power during motor imagery. A BCI control feature (red box) ipsilateral to the affected hand was chosen (contact C3). B, During a home-based BCI control session, a similar spatiospectral pattern of movement-related EEG activity was observed. C, The mean (±SE) of the hand position in movement and rest trials shows that the patient achieved a high level of BCI control (0% fully closed, 100% fully open).