
Figure 4.
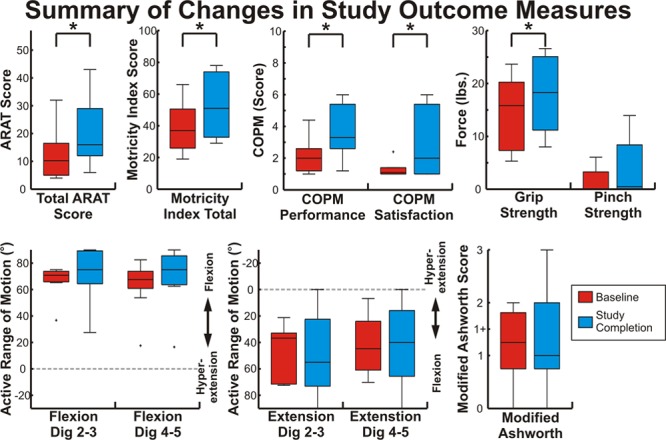
Summary of outcome measures. Each box shows the distribution of each outcome measurement at baseline and study completion. Boxes show the 25th percentile, median, and 75th percentile; bars indicate the range of values; and outliers >2.7 SDs from the mean are marked with a +. Measures with statistically significant (P<0.05) changes are indicated with an *. ARAT indicates Action Research Arm Test; and COPM, Canadian Occupational Performance Measure.