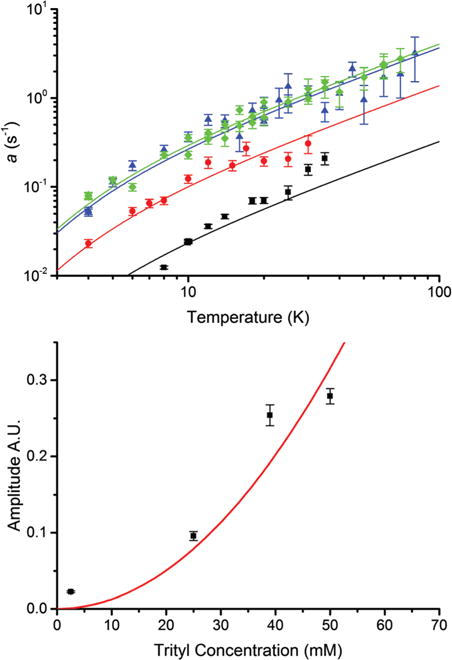
Fig. 4.

Temperature and concentration dependence of the a term for Finland trityl at X-band. The solid lines were obtained by fitting the amplitude of the Orbach–Aminov term to a (upper) at each concentration: 2.5 mM (black, squares), 26 mM (red, circles), 39 mM (blue, triangles) and 50 mM (green, diamonds). The amplitudes are fit by a quadratic concentration dependence (lower). Error bars are uncertainties from the fits.
