(
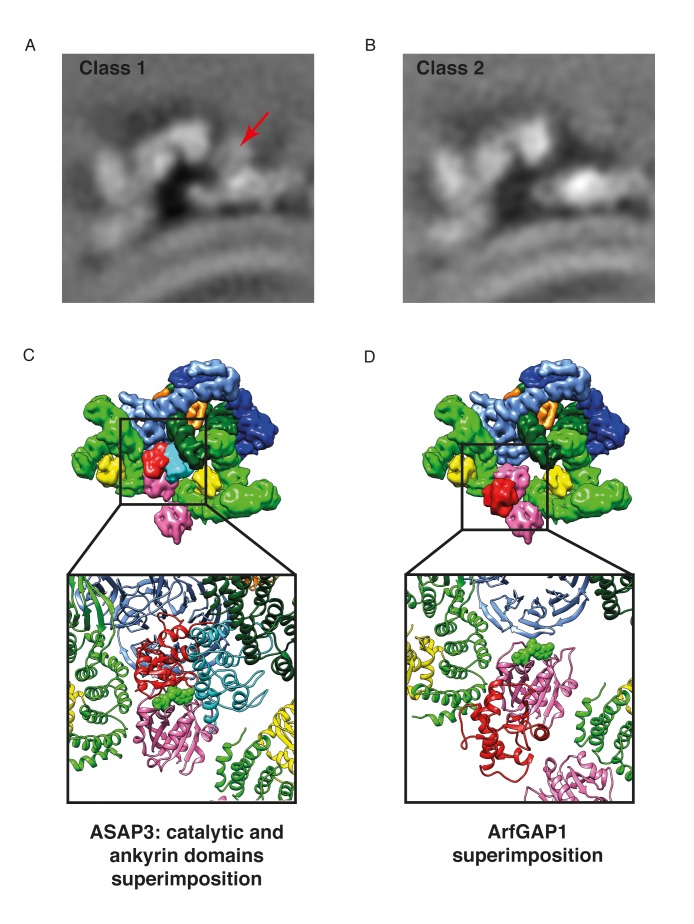
A) The COPI-ArfGAP2 dataset was split into two distinct classes by multireference-based alignment and classification. Slice through the EM density of the class 1 from the COPI-ArfGAP2 dataset, which contains the extra density corresponding to the ArfGAP2 catalytic domain. The slicing plane is orthogonal to the membrane. The additional density is marked with an arrow. (
B) Slice through the EM density of the class 2 from the COPI-ArfGAP2 dataset, which did not contain any additional densities in comparison with the control structure. The slicing plane is orthogonal to the membrane. (
C) Position of the catalytic domain (red) and ankyrin domain (cyan) based on the Arf6-ASAP3 structure (PDB:3LVQ). The Arf1 from the Arf6-ASAP3 structure was superimposed with the Arf1 in our model. Note, that the ankyrin domain clashes with the β-COP (dark green). The existence of a small COPI-niche suggests that there may be sterical selection for the type of ArfGAP protein interacting with Arf1 in the context of the COPI coat. (
D) Position of the catalytic domain (red) based on the Arf1-ArfGAP1 structure, where Arf1 in the Arf1-ArfGAP structure was superimposed on the Arf1 in our model (
Goldberg, 1998). Note, that the catalytic domain is far from the nucleotide site (nucleotide is shown in green). Color scheme: Arf1 - pink, γ-COP – light green, β-COP - dark green, ζ-COP - yellow, δ-COP - orange, β’-COP - light blue, α-COP – dark blue. Compare panels C and D with our structural model illustrated in
Figure 7C).


