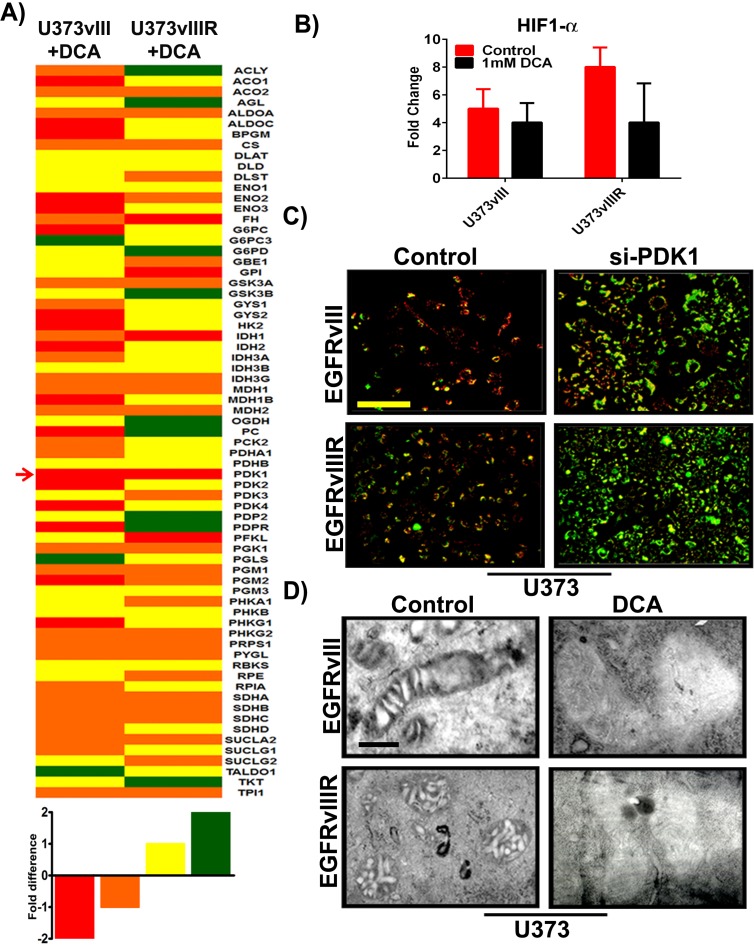
Figure 4. Differential expression of key genes involved in glucose metabolism; si-PDK1/DCA induce mitochondrial apoptosis and ΔΨm change.
A. Heat map demonstrating the differential expression of various key genes involved in GBM glucose metabolism. Red=strong downregulation, Orange=modest downregulation, Yellow=modest upregulation and Green=strong upregulation B. Quantification of HIF1α gene expression with response to 1mM DCA treatment on U373vIII/U373vIIIR cells (n = 4; p = 0.005). The data presented is normalized to loading control GAPDH C. GBM cells were transfected with siRNA for PDK1. After 72h of transfections, both control and treated cells were monitored for ΔΨm change using JC-1 dye and was analyzed by fluorescence microscopy (Red= J aggregation (live cells); Green=JC-1 monomer (dead cells) D. Identification of mitochondrial morphologies by electron microscopy. Bar=200 nm.

