
Figure 1B. Combined prognostic value of CTC and mDC synthesizing TNF-α after TLR stimulation.
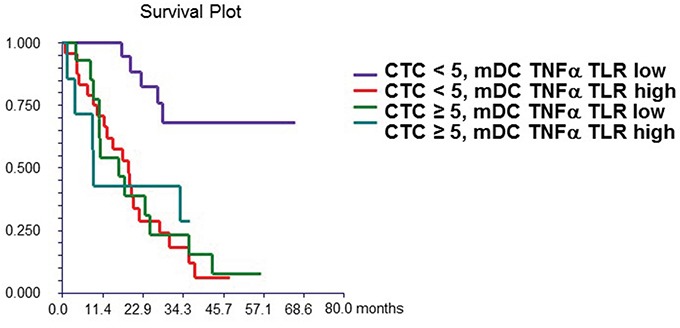
Patients with “high” mDC synthesizing TNF-α after TLR stimulation and CTC ≥ 5 (group 4) had significantly worse survival (median OS = 8.9 months) compared to patients with “low” mDC synthesizing TNF-α after TLR stimulation and CTC < 5 (group 1) (median OS not reached). Patients with either “high” mDC synthesizing TNF-α after TLR stimulation and CTC < 5 (group 2) (median OS = 18.6 months) or “low” mDC synthesizing TNF-α after TLR stimulation and CTC ≥ 5 (group 3) (median OS = 16.1 months) had intermediate prognosis. mDC synthesizing TNF-α after TLR stimulation were dichotomized as “low” or “high” based on median value of percentage of these cells in all patients.