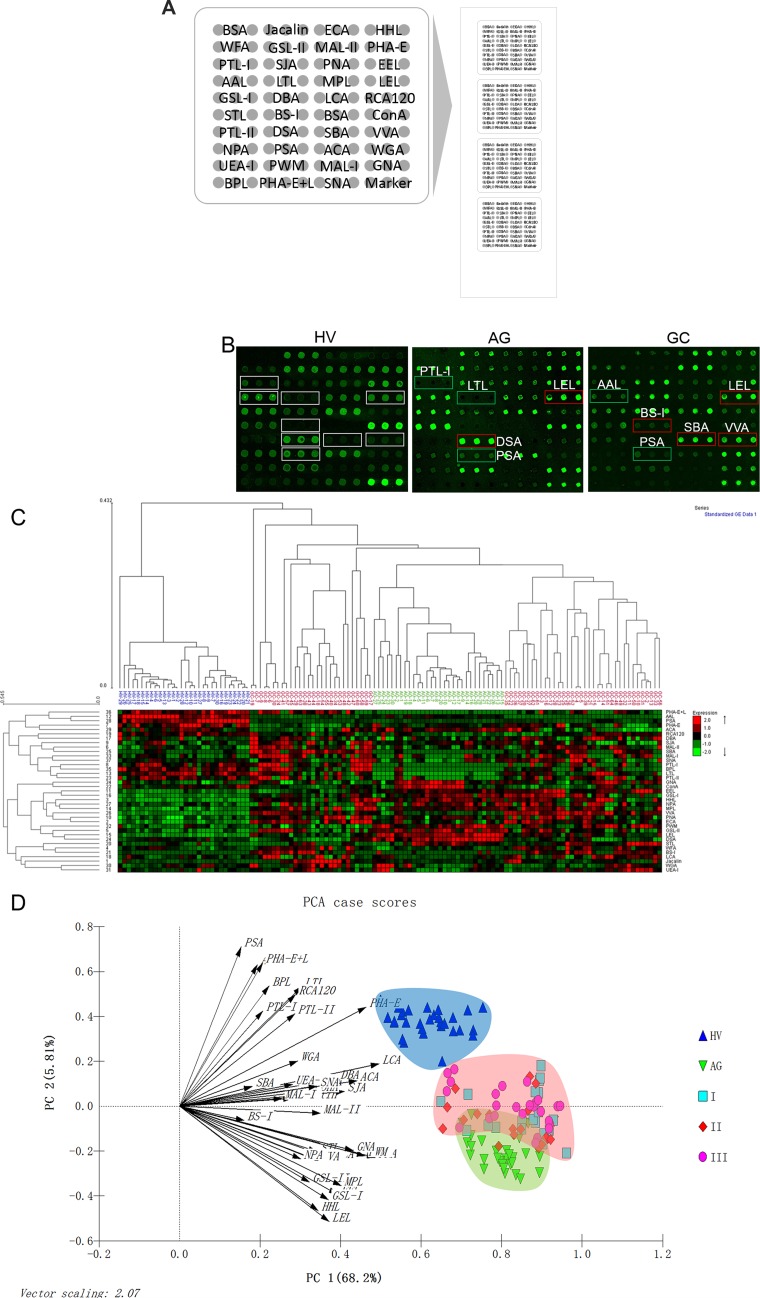
Figure 1. The different salivary glycopatterns in Patients with GC or AG and in HV using a lectin microarray.
(A) The layout of the lectin microarrays. Each lectin was spotted in triplicate per block, with quadruplicate blocks on one slide. Cy3-labeled BSA was spotted as a location marker and BSA as a negative control. (B) The glycopatterns of a Cy3-labeled salivary sample bound to the lectin microarrays. The lectin microarrays revealed significant increase marked with red frames while the significant decrease marked with green frames. (C) Unsupervised average linkage HCA of the lectin microarray responses to saliva. The samples were listed in columns, and the lectins were listed in rows. The color and intensity of each square indicated expression levels relative to the other data in the row. Red, high; green, low; black, medium. (D) The normalized glycopattern abundances responses to three pools were visualized by PCA. HV, AG and GC were indicated by a blue shadow, green shadow and red shadow, respectively.

