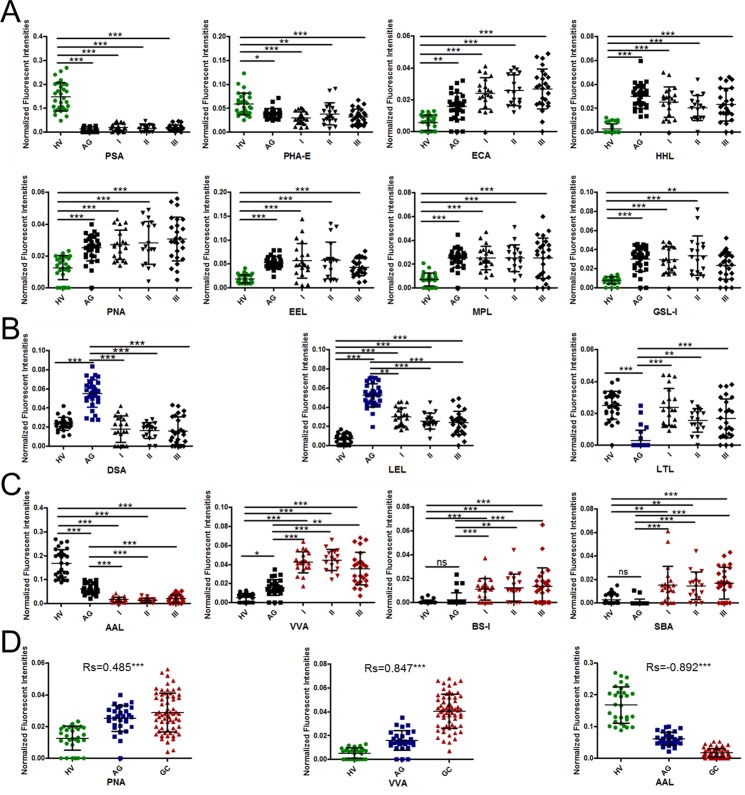
Figure 2. Alterations of salivary glycopatterns between patients with GC or AG and HV.
(A) The difference of salivary glycopatterns between HV and GC&AG. (B) The difference of salivary glycopatterns between AG and HV&GC. (C) The difference of salivary glycopatterns between GC and HV&AG. (D) The scatterplots of Spearman's correlation between pathological type and specific lectins. *P < 0.05; **P < 0.01; and ***P < 0.001.

