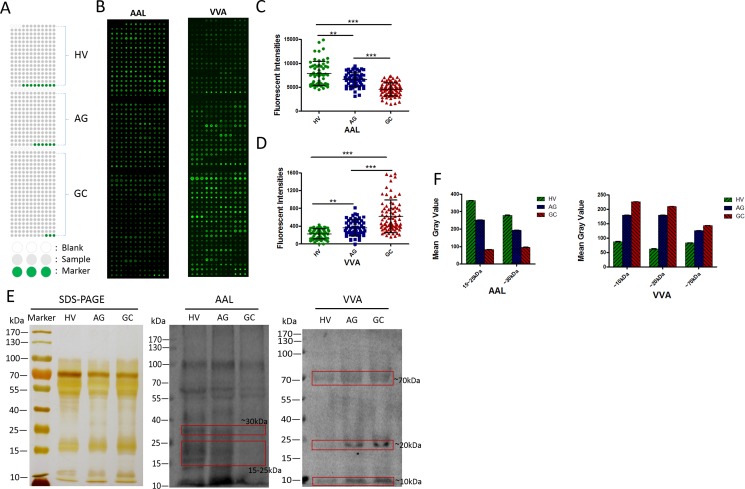
Figure 3. Validation of the differential expressions of the glycopatterns in the saliva among HV, AG and GC.
(A) The layout of a saliva microarrays. (B) Scan images of Cy5-labeled AAL and Cy5-labeled VVA bound to a saliva microarray, respectively. (C) The scatterplots of the original data obtained from the saliva microarrays incubated by Cy5-labeled AAL. (D) The scatterplots of the original data obtained from the saliva microarrays incubated by Cy5-labeled VVA. (E) Binding pattern of glycoproteins from salivary samples of HV, AG and GC using Cy5-labeled AAL and Cy5-labeled VVA. (F) The mean gray value of each apparent difference bands were read by ImageJ.

