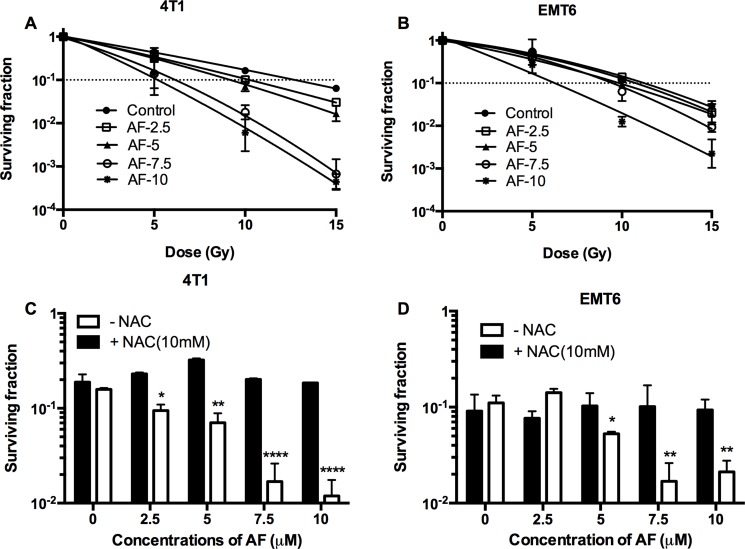
Figure 4. AF radiosensitized hypoxic tumor cells.
4T1 cells were treated with AF for 2 h at indicated concentrations, while NAC (10 mM) was added 1 h prior and during treatment. To assess hypoxic radiosensitivity, subconfluent cultures were irradiated in a metabolic hypoxia model TMCS. (A–B) Radiosensitizing effect of AF was assessed by colony formation assay. Data are shown as mean ± SD (n = 3). (C–D) Counteracting effect of the ROS scavenger NAC at 10 Gy. Data are shown as mean ± SD (n ≥ 3). One-way ANOVA with Bonferonni's multiple comparison test was used to calculate statistics: *p < 0.05, **p < 0.01, ***p < 0.001, ****p < 0.0001.

