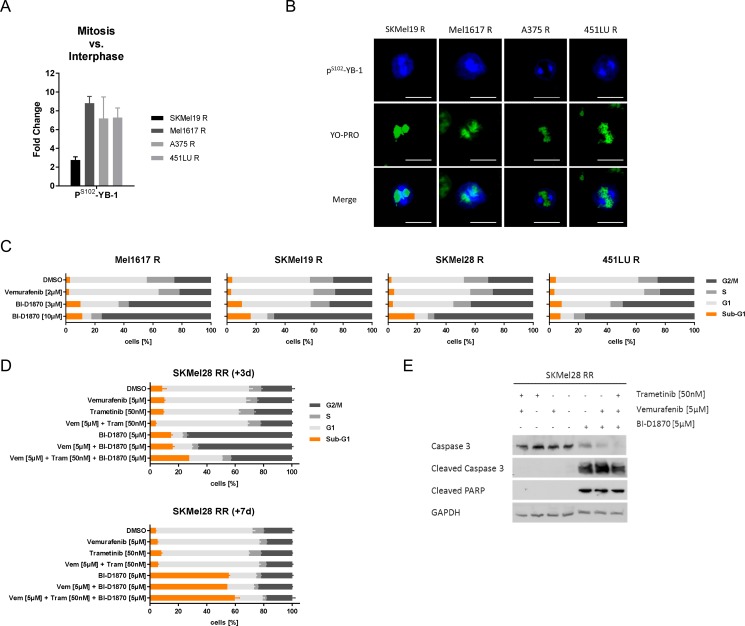
Figure 3. RSK inhibition induces a G2/M arrest and apoptotic cell death in resistant melanoma cells.
(A) Semi-quantification of PS102-YB-1 fluorescence signal intensities following confocal immunofluorescence analysis in vemurafenib resistant melanoma cells. The signals in mitotic cells were normalized to those of interphase cells (n = 4). (B) Confocal immunofluorescence analysis for PS102-YB-1 (Cy5-labelled, blue) in mitotic vemurafenib resistant cells. Nuclei were stained with YOPRO-1 (green). Scale bars represent 25 μm. (C, D) Flow cytometric cell cycle analysis following treatment with signalling pathway inhibitors. Vemurafenib resistant cells were treated with vemurafenib (2 μM) or BI-D1870 (3 μM, 10 μM) for 3 d (C). SKMel28 RR cells were treated with vemurafenib (5 μM), trametinib (50 nM) and BI-D1870 (5 μM) either alone or in combination for 3 d (top panel) or for 7 d (bottom panel). Two independent experiments were performed and representative data shown (mean ± SD, n = 3) (D). (E) Western Blot analysis examining cleavage of the effector caspase 3 and its target PARP in double resistant SKMel28 RR after treatment with signalling pathway inhibitors for 7 d. GAPDH was detected as a loading control.

