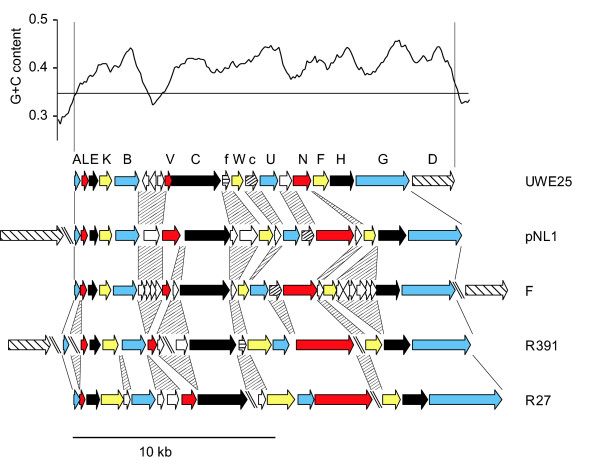
Figure 2.

Comparison of the tra unit of the endosymbiont UWE25 with similar operons of pNL1 (Novosphingobium aromaticivorans), F (Escherichia coli), R391 (Providencia rettgeri) and R27 (Salmonella Typhi) plasmids. In the upper part of the figure: the G+C content of the UWE25 chromosome, around the 1.71 Mb location (1-kb sliding window average, 0.1-kb step). The horizontal line represents the genomic G+C content average. Only the ORFs composed of more than hundred amino-acids are presented on genetic maps of tra units/operons by arrows according to their transcription direction (adapted from Lawley et al. [20]). Colors or patterns are used to indicate tra gene homologs. White genes represent non-conserved transfer genes. Upper case letters refer to the corresponding tra genes, whereas lower case letters f and c stand for trsF and trbC, respectively. Double slashes indicate non-contiguous regions. Interestingly, the G+C-rich genes encoded by the UWE25 chromosome correspond to the ORFs presenting tra homologs.
