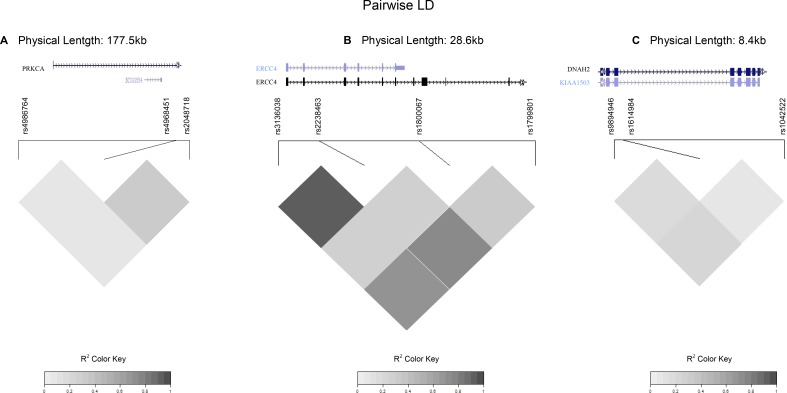
Figure 1. Linkage disequilibrium (LD) maps covering the BRIP1, ERCC4, and TP53 genes.
LD maps based on pairwise r2 values for SNPs investigated in the (A) BRIP1 gene, (B) ERCC4 gene, and (C) TP53 gene. Gene annotations obtained from the UCSC genome browser. Only LD maps of haplotypes in DNA repair genes significantly associated with gastric cancer risk (P < 0.05) are shown in the figure.

