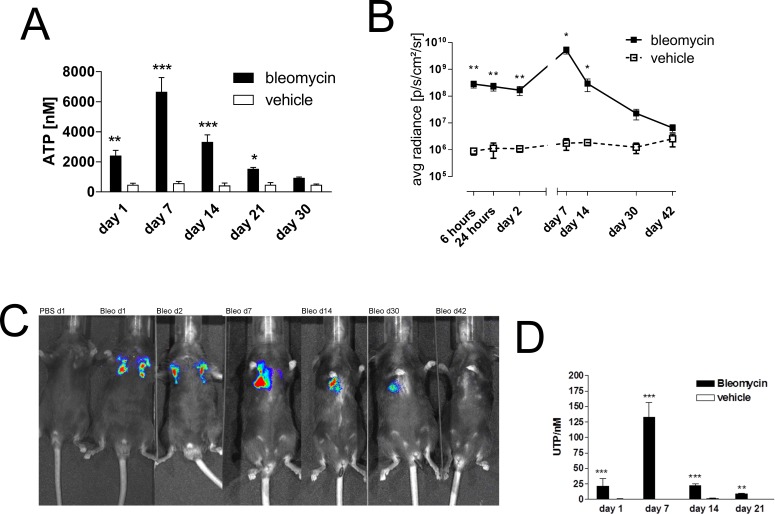
Figure 3. Elevated intrapulmonary nucleotide levels following bleomycin exposure in mice.
(A) Male C57Bl/6 mice received an i. t. injection of BLM or vehicle on day 0. Animals were killed at the indicated time points and ATP levels were measured (n = 4–5 per group). (B–C) Mice received ATP-dependent luciferase-expressing HEK293 cells, followed by an i. t. injection of BLM or vehicle on day 0. Bioluminescence was quantified at the indicated time points (n = 3–6 per group). (D) Male C57Bl/6 mice received an i. t. injection of BLM or vehicle on day 0. Animals were killed at the indicated time points and UTP levels were measured (n = 4–5 per group). *p < 0.05; **p < 0.01; ***p < 0.001.

