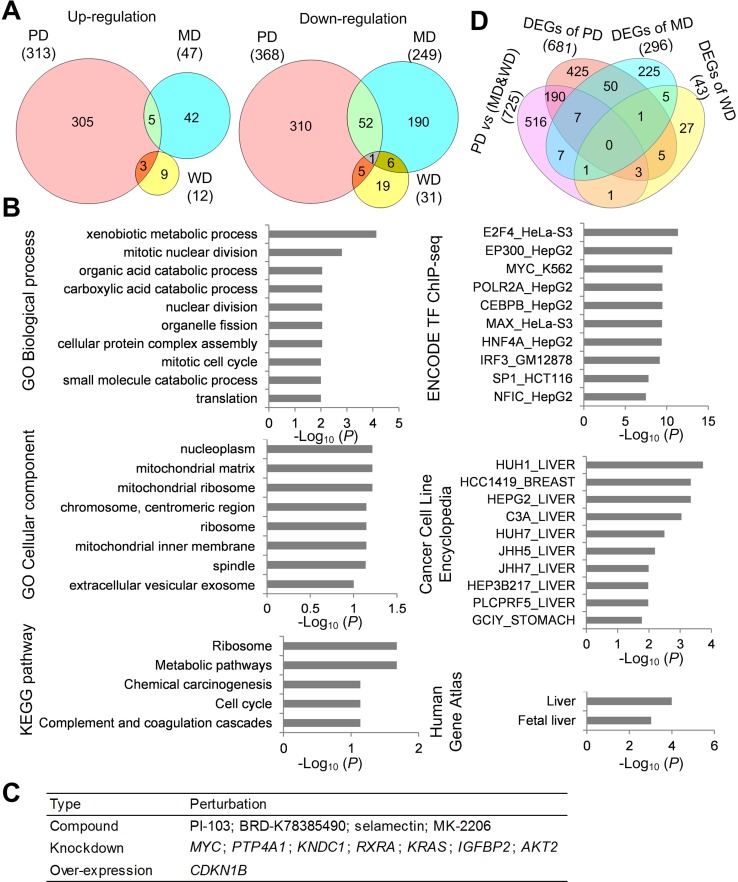
Figure 2. Functional characterization of DEGs.
(A) Venn diagram of DEGs between poorly differentiated (PD), moderately differentiated (MD) and well differentiated (WD) HCC. (B) Functional enrichment analysis of DEGs of poorly differentiated HCC. (C) Top 12 perturbations with high negative connectivity scores with DEGs of poorly differentiated HCC. (D) Venn diagram of DEGs between PD HCC tumor tissues and MD&WD tumor tissues, DEGs of PD HCC, DEGs of MD HCC, and DEGs of WD HCC.

