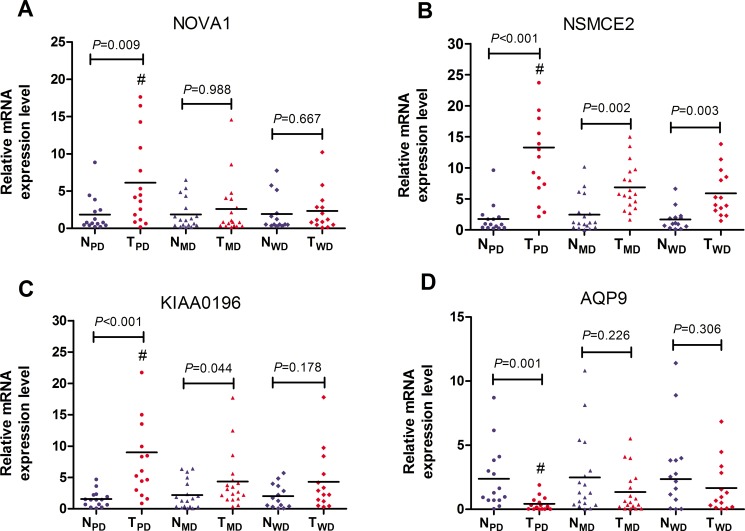
Figure 3. RT-PCR validation of 4 DEGs specific for poorly differentiated HCC.
GAPDH mRNA was used as an internal control. Expression data were obtained as 2−ΔΔCT relative to adjacent non-tumor tissue values. NPD and TPD represented matched adjacent non-tumor tissue specimens (n = 15) and poorly differentiated HCC tissue specimens (n = 15) respectively. NMD and TMD represented matched adjacent non-tumor tissue specimens (n = 18) and moderately differentiated HCC tissue specimens (n = 18) respectively. NWD and TWD represented matched adjacent non-tumor tissue specimens (n = 14) and well differentiated HCC tissue specimens (n=14) respectively. (A) NOVA1; (B) NSMCE2; (C) KIAA0196; (D) AQP9. #P < 0.05 vs TMD and TWD.

