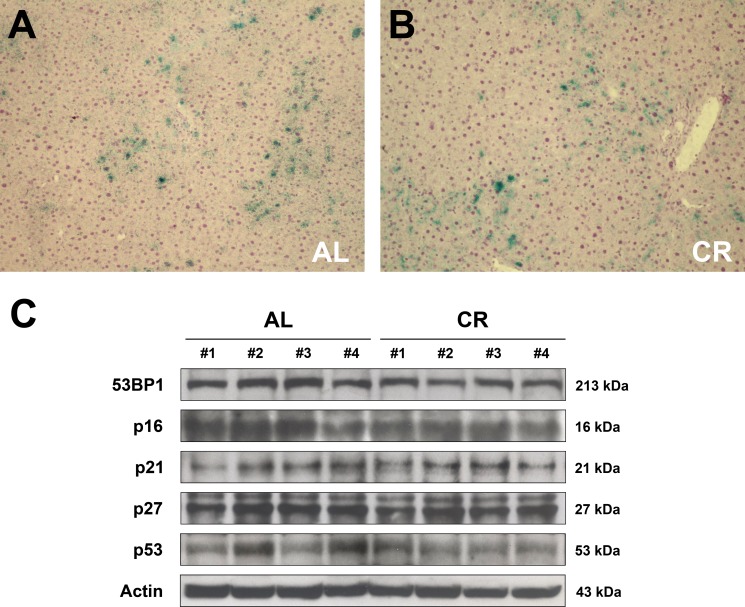
Figure 6. Markers of cell senescence in the liver of animals fed either AL or CR diet for 17 months, followed by AL feeding for 3 months (see Figure 3 for experimental details).
(A and B) report histochemical staining for SA-β-gal in AL and CR groups, respectively. Expression of 53BP1, p16, p21, p27 and p53 is presented in (C). No intergroup differences were seen in any of these proteins.

