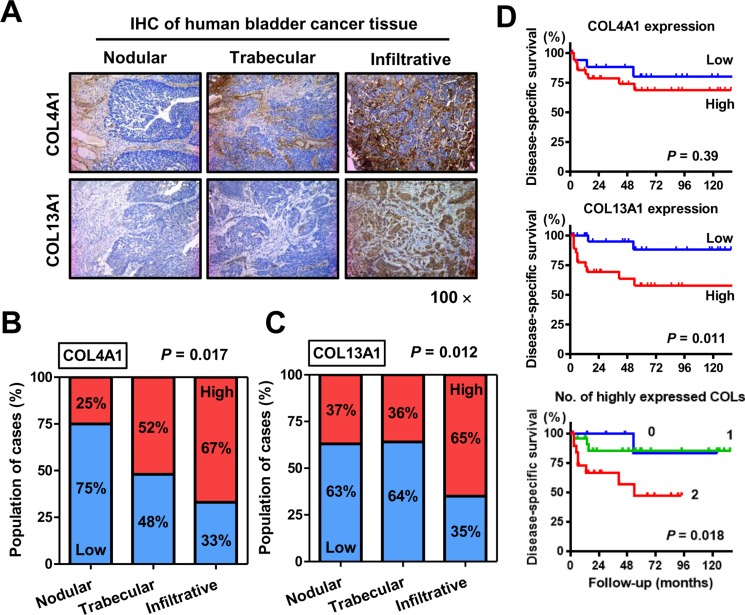
Figure 4. Immunohistochemical (IHC) staining analysis of COL4A1 and COL13A1 in bladder tumor tissues.
(A) Representative images of human UCB with nodular, trabecular, and infiltrative growth patterns. COL4A1 and COL13A1 expression levels are increased in T1 high-grade tumors with infiltrative growth patterns. All images were captured at 100× magnification. (B, C) Quantification of expression levels of COL4A1 (B) and COL13A1 (C) in three growth patterns. Blue bars and red bars indicate percentages of the population with low expression and high expression, respectively. Data are based on analysis of 97 human bladder tumors. (D) Disease-specific survival curves of patients with MIBC after radical cystectomy according to expression levels of COL4A1 (top) or COL13A1 (middle) or according to the number of highly expressed collagens (bottom). The log-rank test (top, middle) or the log-rank test for trend (bottom) was used for comparison.

