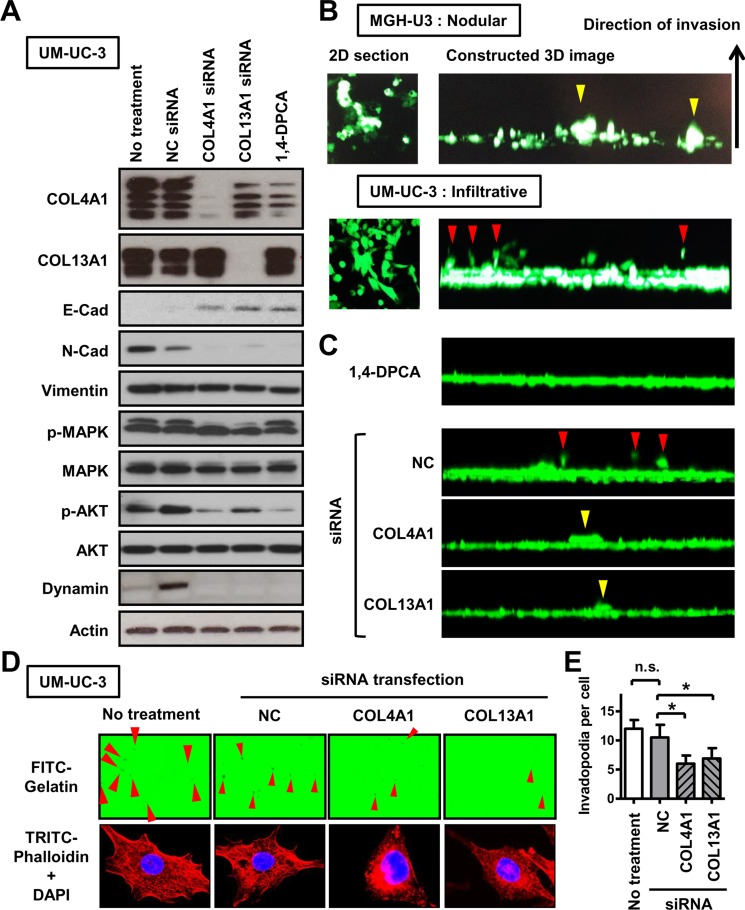
Figure 5. The association of COL4A1 and COL13A1 produced in UCB cells with the formation of the infiltrative growth pattern.
(A) EMT-related markers, proteins involved in the activation of intracellular signaling pathways, and an invadopodia-related marker were quantified by western blot analysis in UM-UC-3 cells, which has high endogenous expression of COL4A1 and COL13A1 proteins. The list of antibodies and conditions are shown in Supplementary Table 3. Actin was used as a loading control. Four bands for COL4A1 and two bands for COL13A1 were detected. (B) Representative images of results of 3-D collective inverse invasion assay of MGH-U3 and UM-UC-3 cells. Optical 2-D sections of cells stained with calcein AM invading Matrigel, taken at 10-μm intervals by confocal microscopy. Right panels represent reconstructed 3-D images of cell invasion from a stack of confocal Z-series images, viewed from the side. Yellow and red arrowheads indicate nodular invasion pattern of MGH-U3 and infiltrative invasion pattern of UM-UC-3, respectively. (C) Representatives of 3-D images of UM-UC-3 cells treated with 1 μM 1,4-DPCA or transfected with NC siRNA, COL4A1 siRNA, or COL13A1 siRNA are shown. Red and yellow arrowheads indicate infiltrative and nodular invasion patterns, respectively. (D) Representative images of FITC-gelatin degradation invadopodia assay using non-treated or NC siRNA-, COL4A1 siRNA-, or COL13A1 siRNA-transfected UM-UC-3 cells. Co-localization of matrix degradation spots with phalloidin-stained F-actin validates these foci as invadopodia. Red arrowheads indicate formed invadopodia. Images were captured by microscope objective lens with synthetic oil immersion at high magnification of 1,000×. (E) The number of formed invadopodia was counted and quantified for 20 cells in each group. Data are expressed as the mean ± SD of three independent experiments; *P < 0.05.

