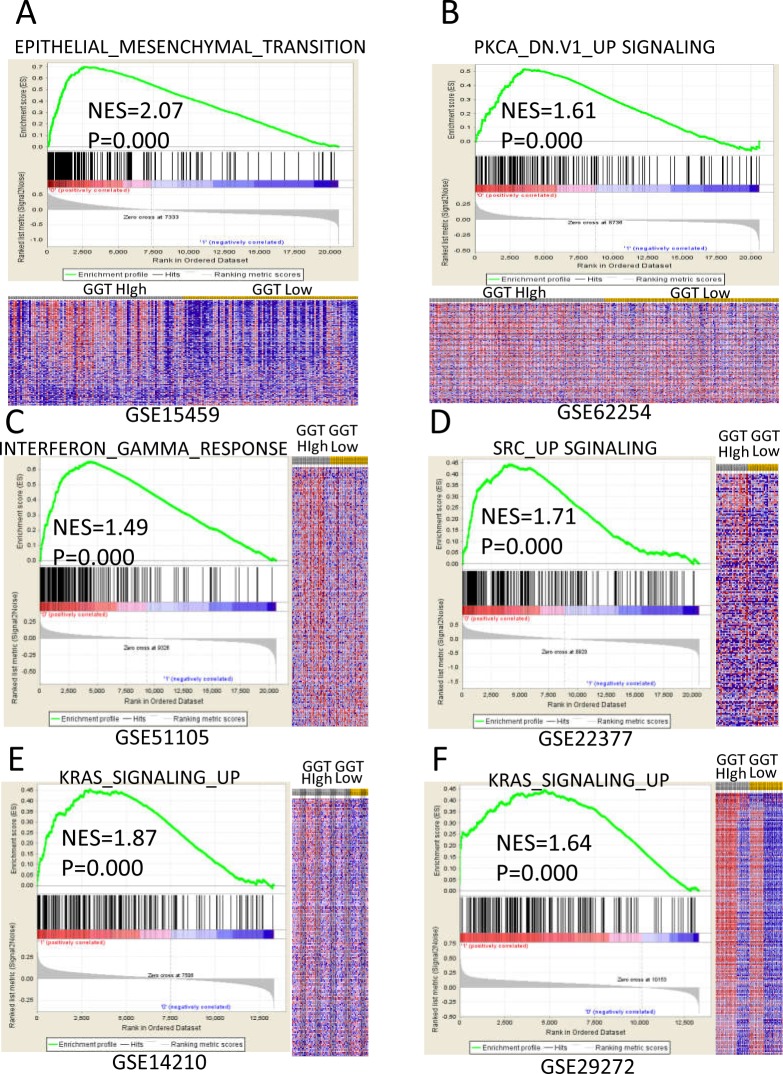
Figure 4. Enriched gene signatures of high GGT group are associated with proliferation and metastasis of gastric cancer.
NES (Normalized Enrichment Score) represents score for the gene-set enrichment analyses. The ranked list metric was generated by calculating the signal-to-noise ratio, which is based on the difference of means scaled according to the standard deviation. The signal-to-noise ratio determine the distinction of a gene expression for each phenotype, which makes the gene acts as a “class marker”. The detailed information of computational method is list in the website of The Broad Institute Gene Set Enrichment Analysis website (www.broad.mit.edu/gsea). The heat maps show the enrichment of genes in the gene sets. Rows represent each gene, and columns are individual samples. Each cell in the matrix represents the expression level of a gene in an individual sample. Red indicates a high level of expression, and green indicates a low level of expression. In each dataset, the most up-regulated enriched gene set in GGT-high (annotated as high in the figure) group was picked and listed as following: (A) Epithelial-Mesenchymal Transition (EMT) signature in GSE15459 dataset; (B) PKCA signaling in GSE62254 dataset; (C) Interferon Gamma Response signature in GSE51105 dataset; (D) SRC signaling in GSE22377 dataset; (E&F) KRAS signalingGSE14210 and GSE29272 datasets.

