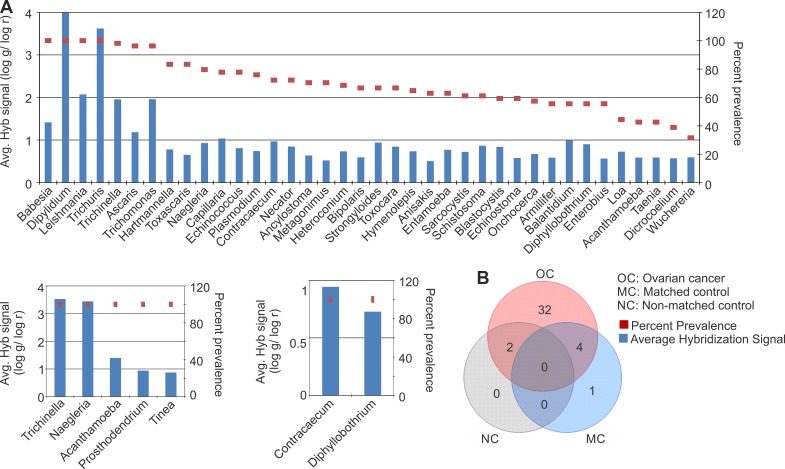
Figure 4. Parasitic signatures detected in ovarian, matched and non-matched controls.
(A) Parasitic signatures detected in ovarian cancer, matched and non-matched controls. The prevalence of those signatures are represented in the decreasing order as dots, and their average hybridization signal being represented as a bar graph. (B) Venn diagram showing the number of parasites common or unique to the ovarian cancer and control samples.

