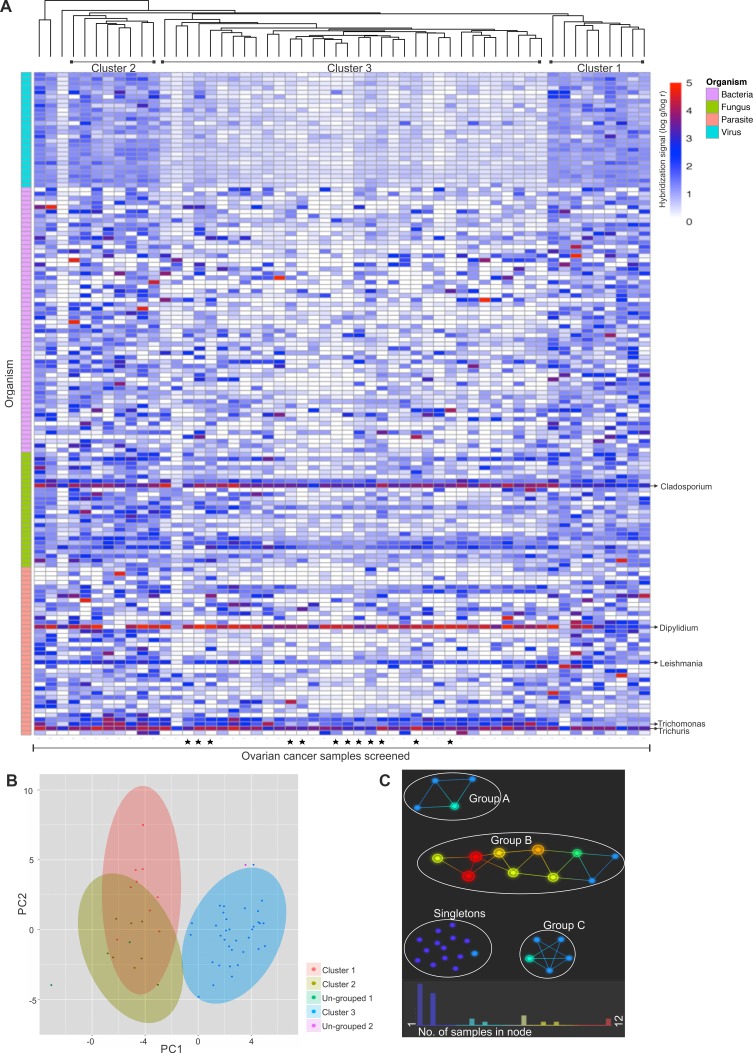
Figure 5. Hierarchical clustering of ovarian cancer samples screened.
Hierarachial clustering of 99 ovarian cancer samples. (A). Hierarchial clustering by R program using Euclidean distance, complete linkage and non-adjusted values. Samples marked (▪) were the samples that were screened in pools, rest were screened individually. (B). Clustering of the OSCC samples using NBClust software [CH (Calinski and Harabasz) index, Euclidean distance, complete linkage]. (C). Topological analysis using Ayasdi software, using Euclidean (L2) metric and L-infinity centrality lenses. The cancer samples that had similar detection for viral and microbial signatures formed the nodes, and those nodes are connected by an edge if the corresponding node have detection pattern in common to the first node. Each nodes are colored according to the number of samples clustered in each node.

