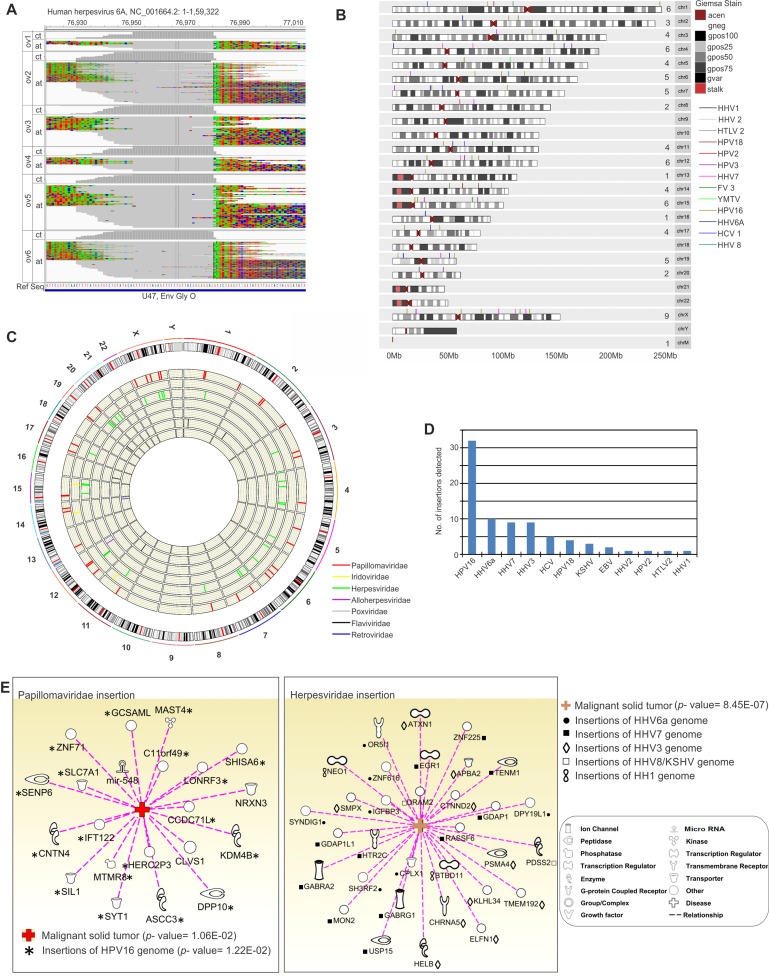
Figure 7. Viral genomic integrations in the host chromosome.
(A). Alignment of the MiSeq reads to the reference of HHV6A, showed soft-clipped regions that do not align to the corresponding viral reference sequences. These soft-clipped reads shown were then extracted from the alignment and mapped (containing sequences of potential pathogen-integrated human loci) to the human genome, which reveals the exact human and pathogen integration breakpoints. (B). Karyogram plot of virus insertion sites in human chromosomes. All the insertion sites were included. The number of insertion sites in each chromosome is mentioned in the figure before chromosome number. G-banding annotation for each chromosome is shown; gneg - Giemsa negative bands; The Giemsa positive bands have further been subdivided into gpos25, gpos50, gpos75, and gpos100 with the higher number indicating a darker stain; acen - centromeric regions; gvar - variable length heterochromatic regions; stalk - tightly constricted regions on the short arms of the acrocentric chromosomes (C). Circos plot highlighting fusion events for the viral insertions into individual human chromosomes. All the reads were taken into account and chromosome numbers are mentioned. Viral insertions for individual families are represented in the inner concentric circular tracks. The outermost track shows all the insertions taken together highlighting the karyotype of each chromosome. (D). The number of individual viral genomic insertions in human somatic chromosomes detected in the study are shown. (E) Association of host genes affected by viral genomic integrations to malignant tumor formation, analysed by Ingenuity Pathway Analysis (IPA) program that showed highly significant p- value for such association.

