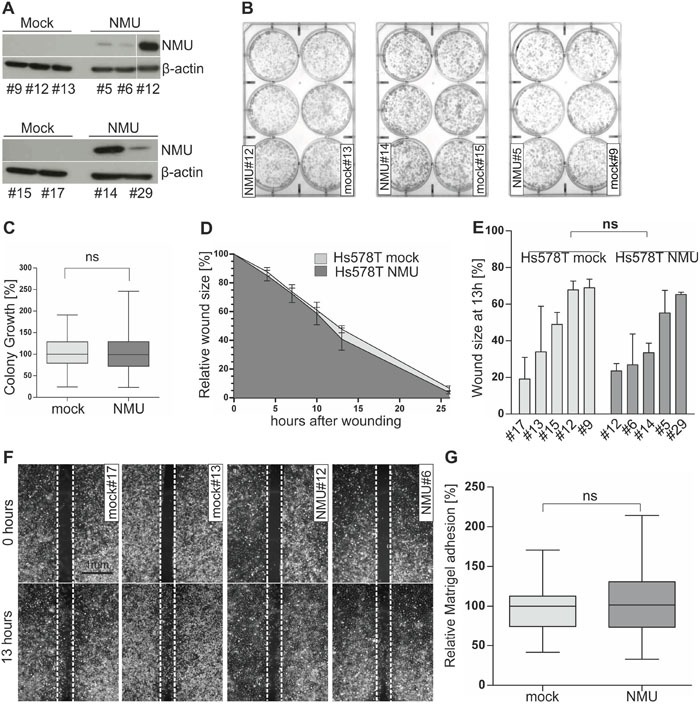
Figure 6. Ectopic NMU expression has no effect on NMUR2-negative Hs578T cells.

(A) NMU protein expression of stably transfected independent Hs578T mock (#9, #12, #13, #15, #17) and NMU (#5, #6, #12, #14, #29) clones. (B) Representative 6-well plates containing stable Hs578T mock and NMU clones are shown 2 weeks after cell seeding. (C) Densitometrical evaluation of 2D colony growth after 2 weeks. Box plot presents median colony growth of triplicate experiments for stably transfected independent Hs578T mock (n=5) and NMU (n=5) clones. Horizontal lines: grouped medians. Boxes: 25-75% quartiles. Vertical lines: range, minimum and maximum, ns: not significant (Mann-Whitney-U test). (D) Comparison of cell migration of stably transfected Hs578T mock (n=5) and NMU (n=5) clones analyzed by monolayer wound healing assay over 26 hours. Vertical lines: standard deviation of triplicates. Cell-free area at hour 0 was set 100% and used for standardization. (E) Detailed comparison of wound closure for each clone after 13h, vertical lines: standard deviation of triplicates, ns: not significant (Mann-Whitney-U test). (F) Wound documentation by phase contrast microscopy at time point 0 and 13h after start of experiment. Scale bar: 1000μm. (G) Cell-matrix adhesion of stably transfected Hs578T mock (n=5) and NMU (n=5) clones was measured colorimetrically. Box plot shows median values of 3 independent experiments. Horizontal lines: grouped medians. Boxes: 25-75% quartiles. Vertical lines: range, minimum and maximum, ns: not significant (Mann-Whitney-U test).
