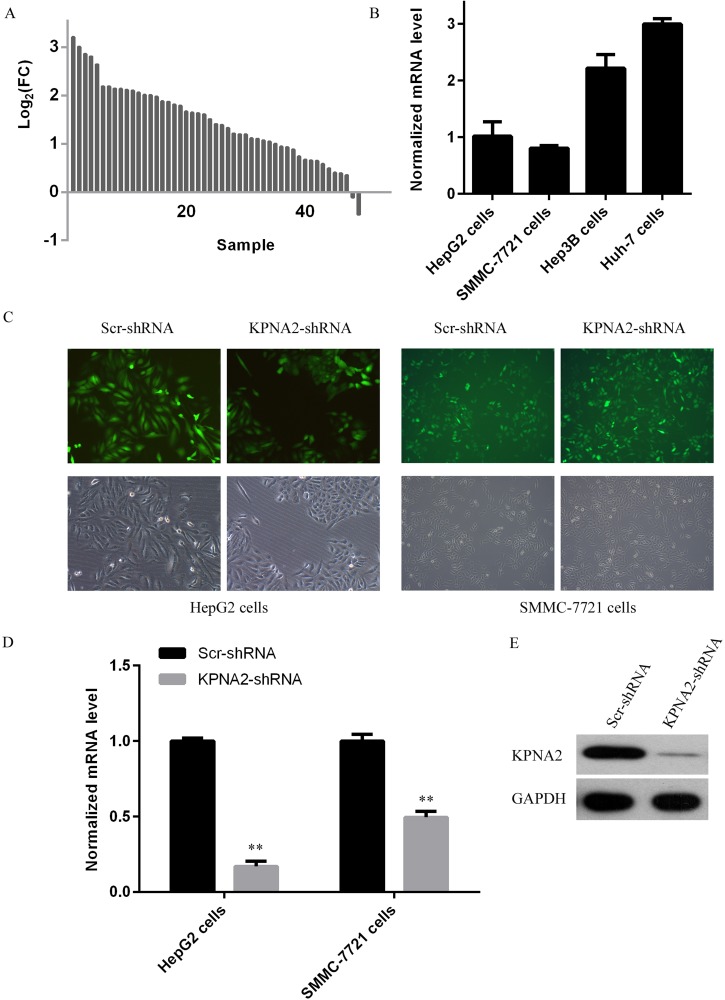
Figure 1. KPNA2 expression status and its knockdown at both the mRNA and the protein levels in human hepatocellular carcinoma cell lines HepG2 and SMMC-7721 using a lentivirus-mediated shRNA strategy.
(A) Line chart for KPNA2 expression at the mRNA level in human hepatocellular carcinoma tissues and adjacent normal tissues obtained from the TCGA database. A total number of 50 paired lung adenocarcinoma samples were used (B) KPNA2 expression in four different human hepatocellular carcinoma cell lines, HepG2, SMMC-7721, Hep3B and Huh-7 cells was analyzed with quantitative real-time PCR analysis (normalized to GAPDH mRNA). (C) Microscopic images of HepG2 cells and SMMC-7721 cells infected for 48 hours with lentiviruses expressing either Scr-shRNA or KPNA2-shRNA. The upper images were prepared using a fluorescent microscope and show GFP-positive cells; the bottom images were prepared using a light microscope. Magnification: 100 ×. (D) The relative KPNA2 mRNA levels in HepG2 cells and SMMC-7721 cells infected with lentiviruses expressing either Scr-shRNA or KPNA2-shRNA was determined by quantitative real-time PCR (normalized to GAPDH mRNA). The data shown here are from one out of three independent experiments (**p < 0.01). (E) The relative KPNA2 protein level in 293T cells transfected with a plasmid expressing either Scr-shRNA or KPNA2-shRNA was determined by immunoblotting. The GAPDH protein level was used as an internal control.

