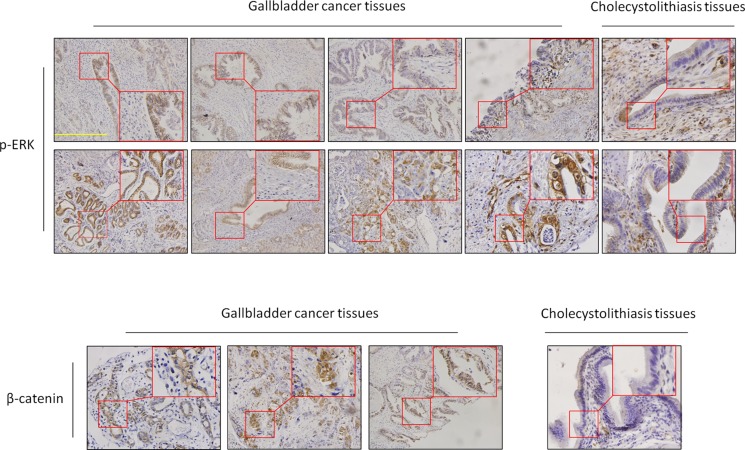
Figure 2. Activation of the MAPK/ERK and Wnt/β-catenin pathways in GBCs.
Immunohistochemistry analysis was performed to evaluate the levels of p-ERK1/2 and β-catenin in GBCs and normal gallbladder tissues. The positive staining was shown in a reddish-brown color. All sections were counterstained with Hematoxylin showing a blue color. The insert shows the magnified image of the area indicated by the red square. Scale bars, 200 μm.

