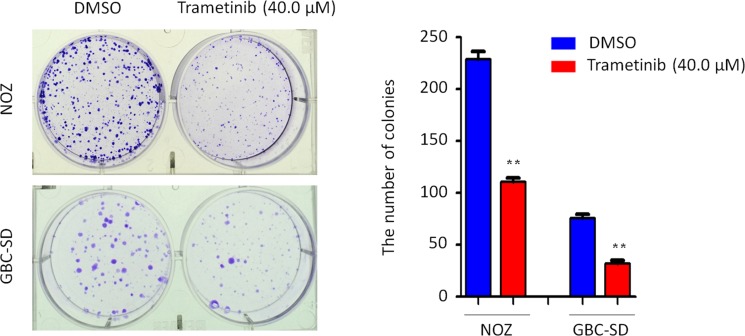
Figure 5. Inhibition of colony formation of GBC cells by trametinib.
Representative images of colony formation in NOZ and GBC-SD cells treated with vehicle control (DMSO) or 40 μM trametinib were shown in left panel. Quantitative analysis of colony numbers was shown in right panel. Data were presented as mean ± SD of values from three different assays. Statistically significant differences were indicated: **P < 0.01.

