Figure 5.

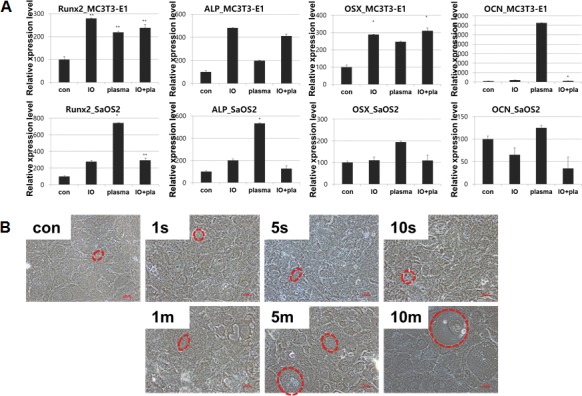
(A) Gene expression after treatment of NBP. (B) Morphological change of osteoblast cells cultured for 10 days after plasma treatment w/o osteogenic induction. Cells were visualized under microscope (magnification; 20×).

(A) Gene expression after treatment of NBP. (B) Morphological change of osteoblast cells cultured for 10 days after plasma treatment w/o osteogenic induction. Cells were visualized under microscope (magnification; 20×).