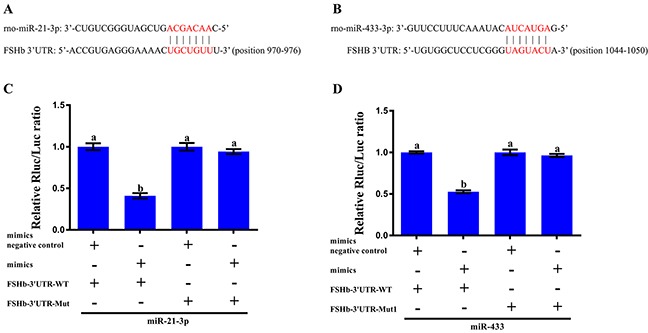
Figure 3. In vitro validation of the interaction between the miRNAs and FSHb.

(A) Sequence alignment of miR-21-3p with the 3′UTR of FSHb from the rat. (B) Sequence alignment of miR-433 with the 3′UTR of FSHb in the rat. The seed match region predicted by the TargetScan program is indicated in red. (C) Relative luciferase activity of the pmiR-FSHb-3′UTR-WT (FSHb-3′UTR-WT) and pmiR-FSHb-3′UTR-MUT (FSHb-3′UTR-MUT) vectors in 293T cells cotransfected with the mimic negative controls and miR-21-3p mimics. (D) Relative luciferase activity of the pmiR-FSHb-3′UTR-WT (FSHb-3′UTR-WT) and pmiR-FSHb-3′UTR-MUT1 (FSHb-3′UTR-MUT1) vectors in 293T cells cotransfected with the mimic negative controls and miR-433 mimics. Relative luciferase activity was measured 48 h after transfection and normalized to the Renilla luciferase activity generated through cotransfection with the pmiR-RB-REPORTTM vector. The normalized luciferase activity for the controls was set to 1. The data are presented as the mean ± standard deviation from at least three independent experiments; statistical significance was determined through one-way ANOVA; and P<0.05 was considered significant. The panels with different letters were considered statistically significant (P<0.05).
